

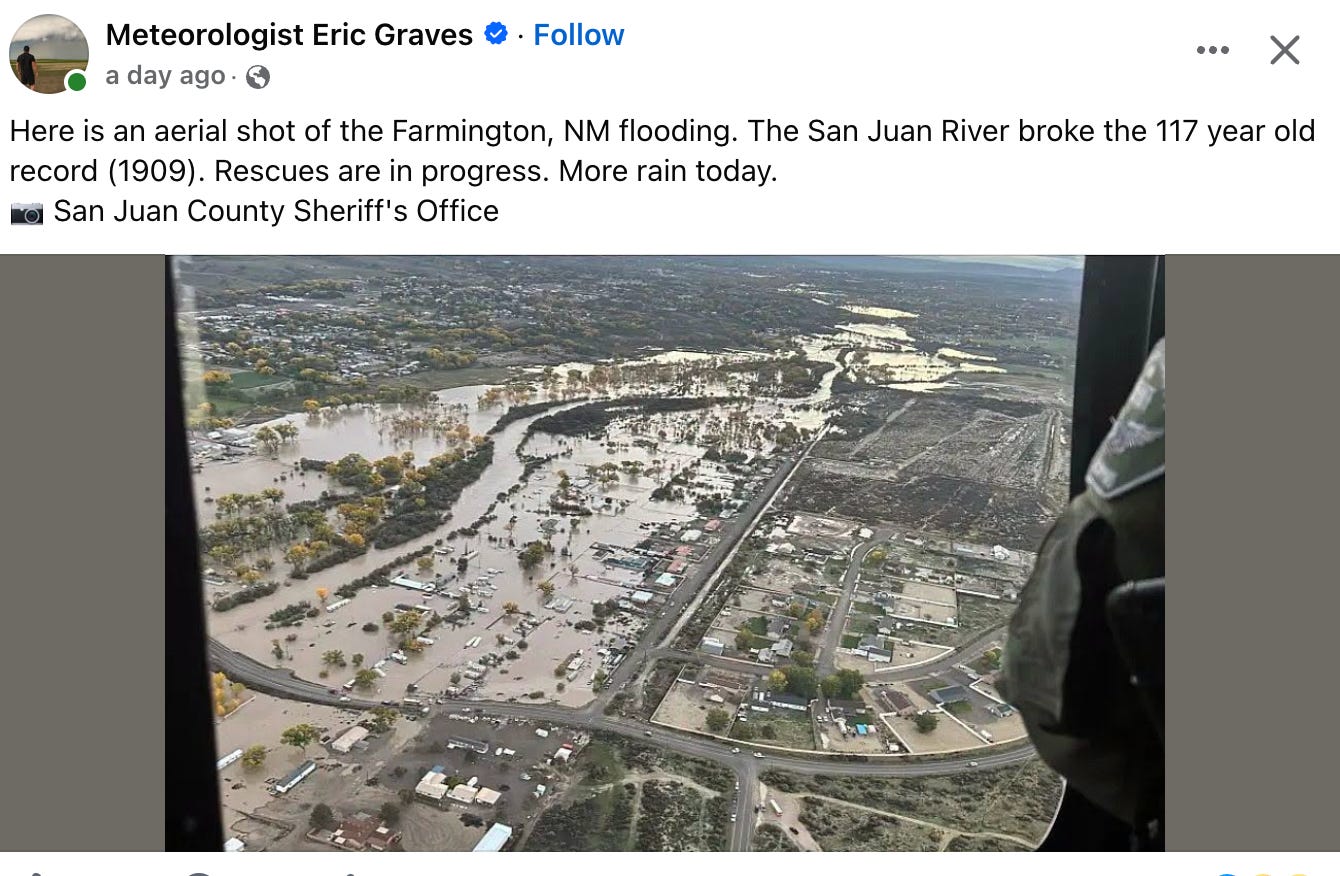
Watching the streamflow gages for Four Corners area rivers has been astounding; seeing the images of the destruction wrought by the high waters is heart-rending. As of mid-day Monday, the rains had mostly moved on, and streamflows were continuing to drop in most areas, but the San Juan River was still running strong at 39,000 cubic feet per second (which appears to be the peak for this storm system). Meanwhile, hundreds of people were only beginning to recover from the flooding, which not only soaked homes and businesses, but also damaged infrastructure — including sewage treatment facilities — sending contaminated water downstream.
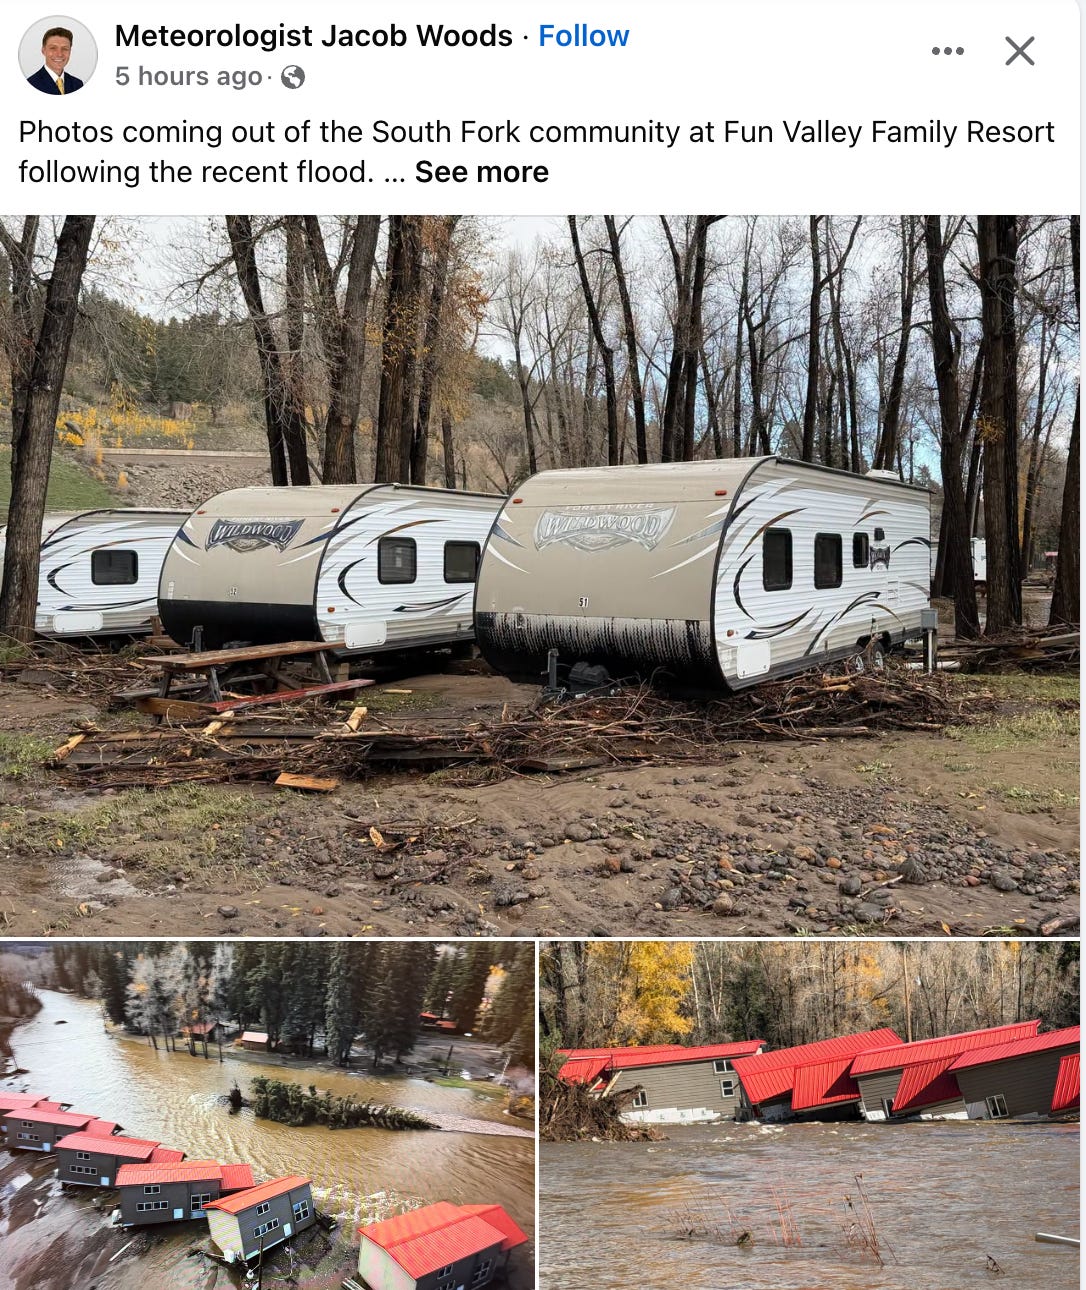
The rains had no more mercy on the other side of the Great Divide, where the Rio Grande and its tributaries have also flooded communities and infrastructure. The South Fork of the Rio Grande rumbled through the Fun Valley RV resort before making its way into streets and homes of San Luis Valley communities such as Del Norte. On Monday, flows were still rising at the USGS gage near Cerro, New Mexico, upstream from the Taos Gorge, indicating that the brunt of the stream surge has not yet reached riverside communities such as Embudo, Ohkay Owingeh Pueblo, or Española.
National and regional news outlets — along with social media weather chasers — are all over the flooding and the damage it brought with it, although the bigger outlets haven’t deeply covered the widespread impacts on the Navajo Nation, where even heavy rains, without any actual flooding, can muck up roads and transportation for days, stranding people in remote areas. For that coverage, I’d urge you to check out the extensive reporting at the Navajo Times.

As for the Land Desk, I’m just trying to get a handle on how these high streamflows fit into the historical context. It’s not easy, in part because there’s a lot of erroneous information floating around, but also because a lot of the streamflow gages were knocked offline before their respective streams hit their peaks. And then there’s the lack of consistent measurements and record-keeping over time.
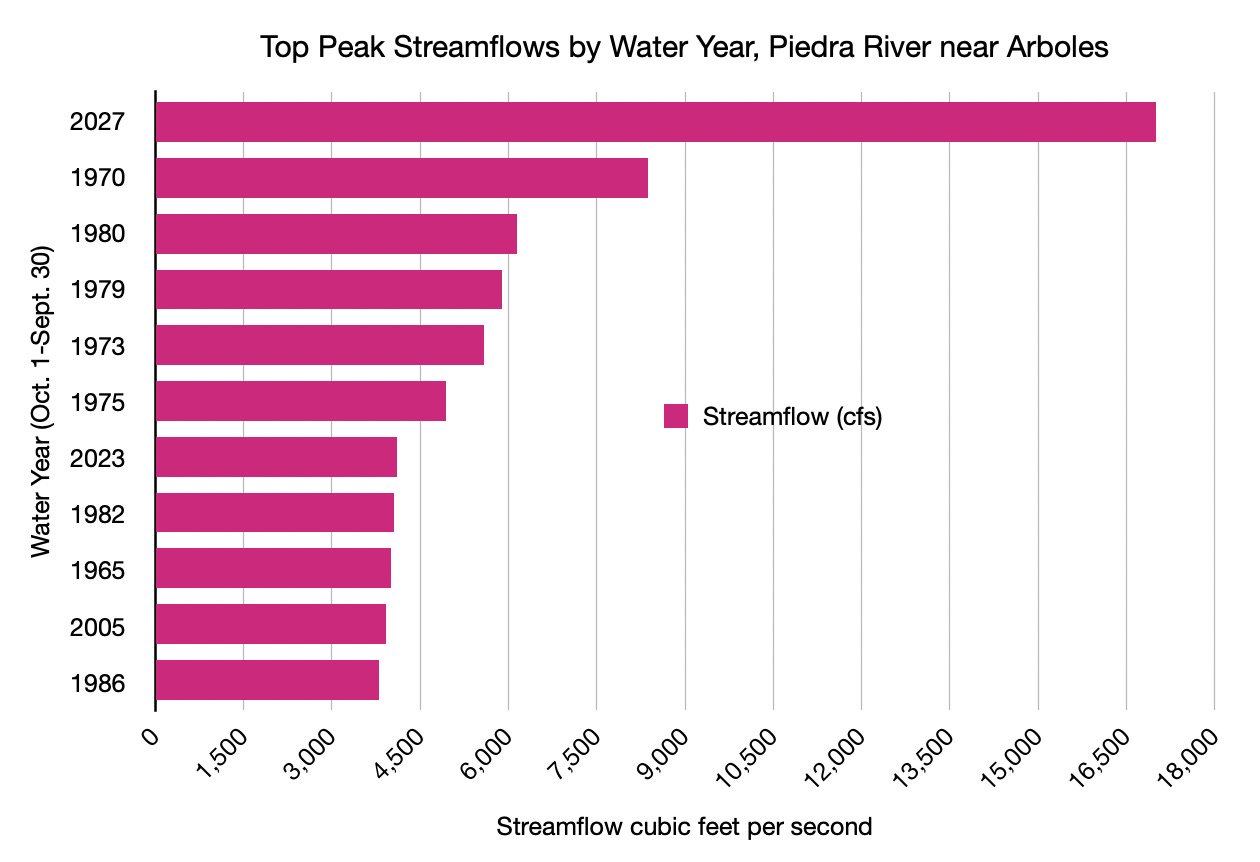
Even so, some of the numbers are just mind-blowing. Take the Piedra River, which runs into the San Juan on the north end of Navajo Reservoir. It reached 17,000 cfs at the USGS gage near its mouth at Arboles then went offline, though it appears that it didn’t rise much higher. Peak streamflow records on this gage only go back to 1964, but still, this year’s flow was more than twice that of the second highest, which came during the flood of September 1970.
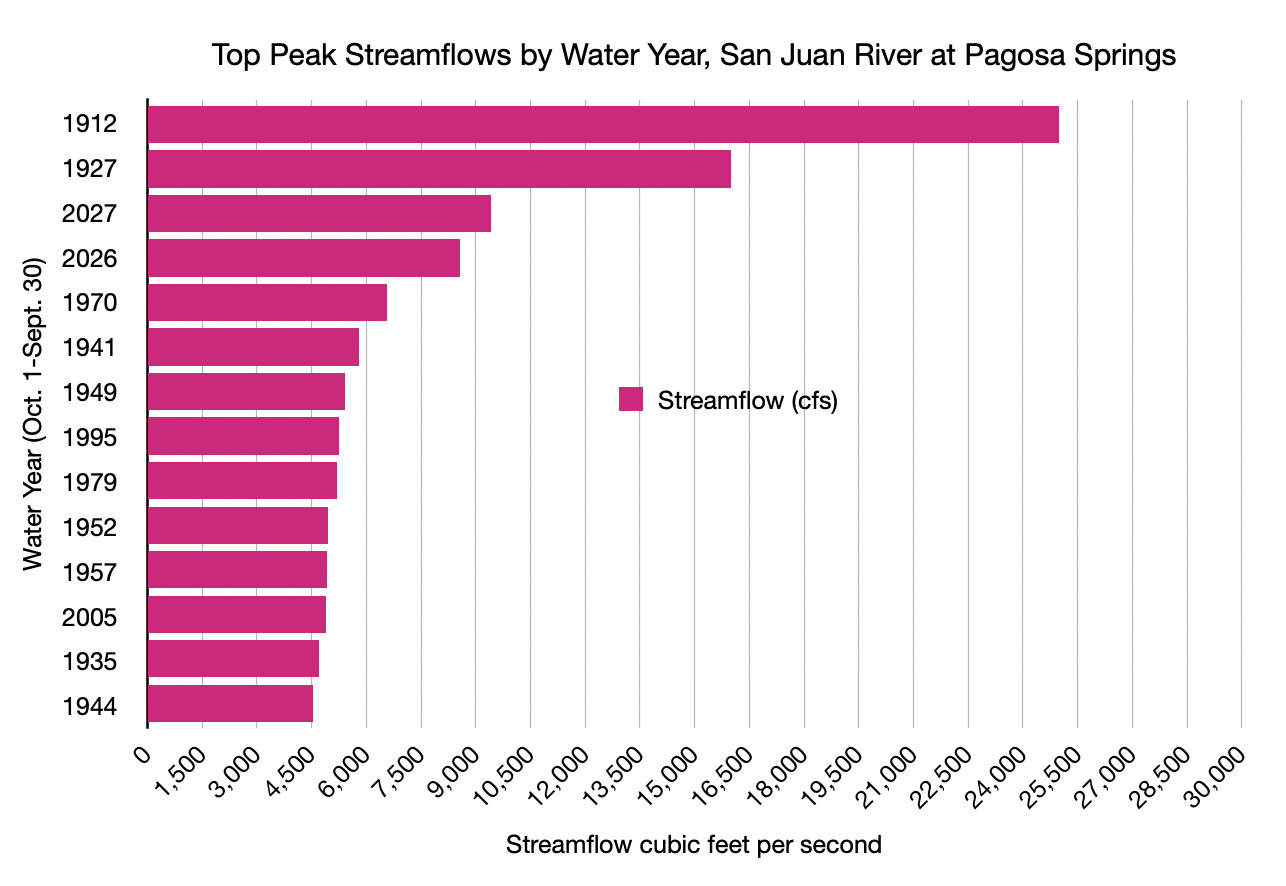
The San Juan River in Pagosa flooded just over a year ago after a huge storm pounded the San Juan Mountains, setting the third highest streamflow on record (eclipsed by the 1911 flood). This year’s flows were even higher, and slipped into the third place spot.
Downstream from there, the San Juan River at Carracas (just upstream from Navajo Reservoir) was raging at 13,000 cfs when it went offline on Oct. 22 (compared to 9,750 cfs in 1970). Combine that with the Piedra flows, and you have at least 30,000 cfs pouring into the reservoir, causing its surface level to shoot up more than 20 feet. Luckily, the reservoir had plenty of room for the new water following the dry summer, meaning it could hold most of it back. Had the dam not been there, the downstream flows would have been far larger, and far more destructive.
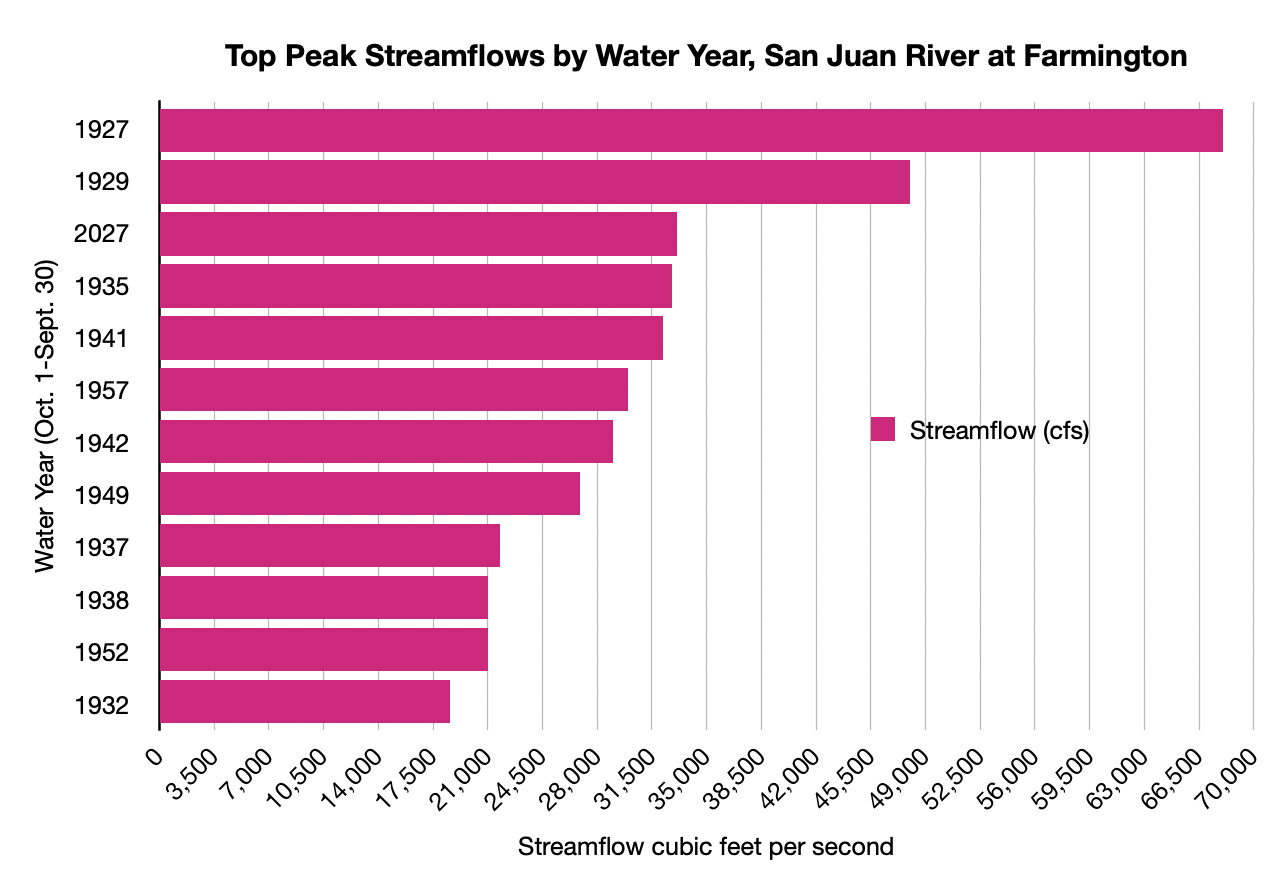
I’ve heard a few news reports say that the San Juan River at Farmington reached the highest levels on record since 1909. I can’t find any evidence that that’s true. Although this gage went offline, a field measurement was taken on Oct. 23 at or near the peak when it was 33,100 cfs. This is still lower than was measured in 1927 and 1929. Estimates for the 1911 Flood are far higher than that (in 1916, USGS hydrologists roughly estimated a 150,000 cfs flow around Shiprock).
Had Navajo Dam not held back that 30,000+ cfs from the San Juan and the Piedra, the flow here very well could have been close to a record high.
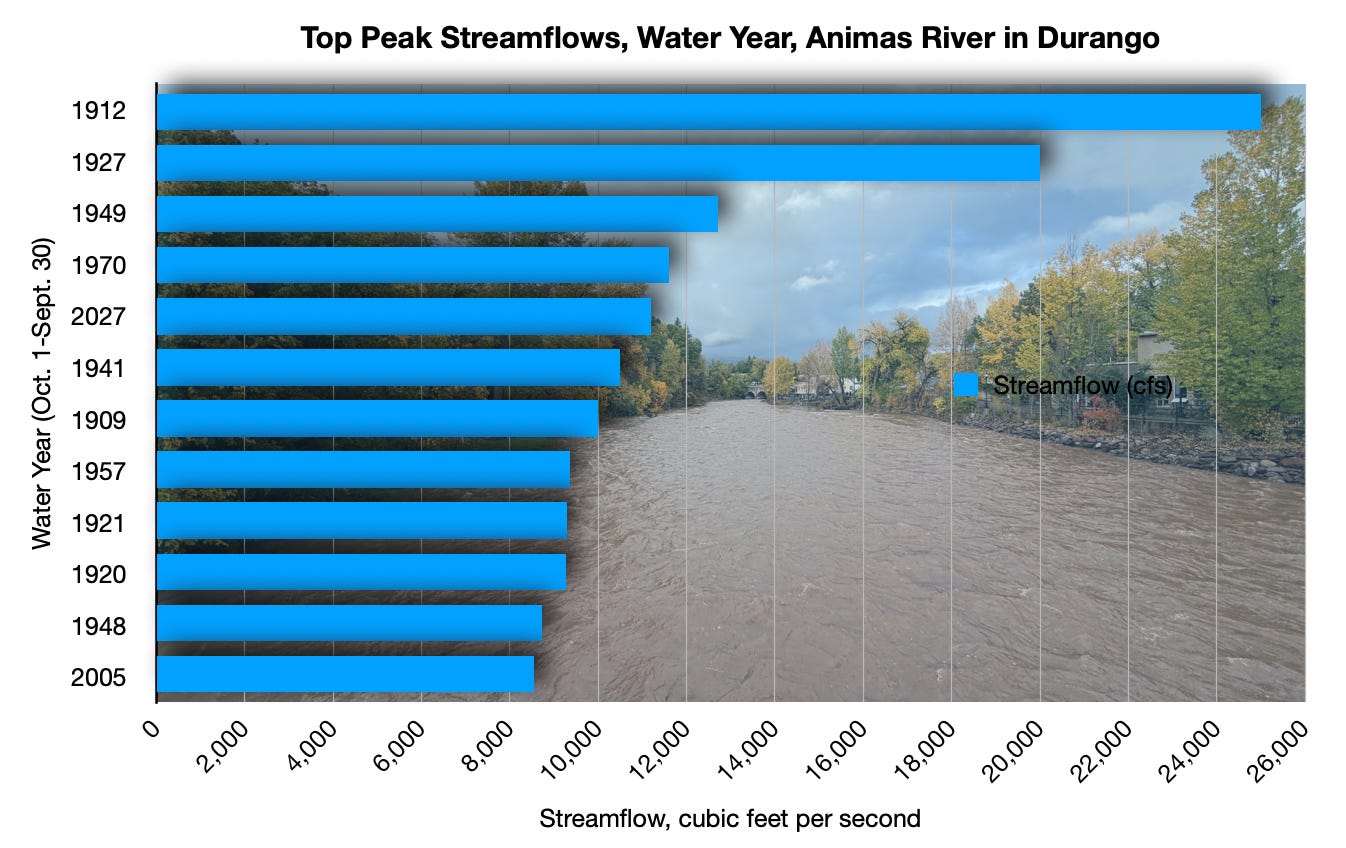
Contributing to the Farmington gage’s flow is the Animas River, a San Juan Tributary. It got huge, but didn’t quite exceed the September 1970 flood’s streamflow. Measured flows in Oct. 1911 (water year 1912), 1927, and 1949 also exceeded this year’s flow.
After Farmington, the San Juan River continues to receive waters from multiple tributaries, including: La Plata River, Shumway Arroyo, Deadman’s Wash, Shiprock Wash, and the Mancos River — all swollen by rains. So by the time it reached the gage at Four Corners, it was running a whopping 54,100 cfs on the night of Oct. 24. Records on this gage only go back to 1988, so there’s not adequate historical context for a good comparison. But it’s indisputably a huge amount of water, and set off alarm bells downstream in Aneth, Montezuma Creek, Bluff, and Mexican Hat, Utah.
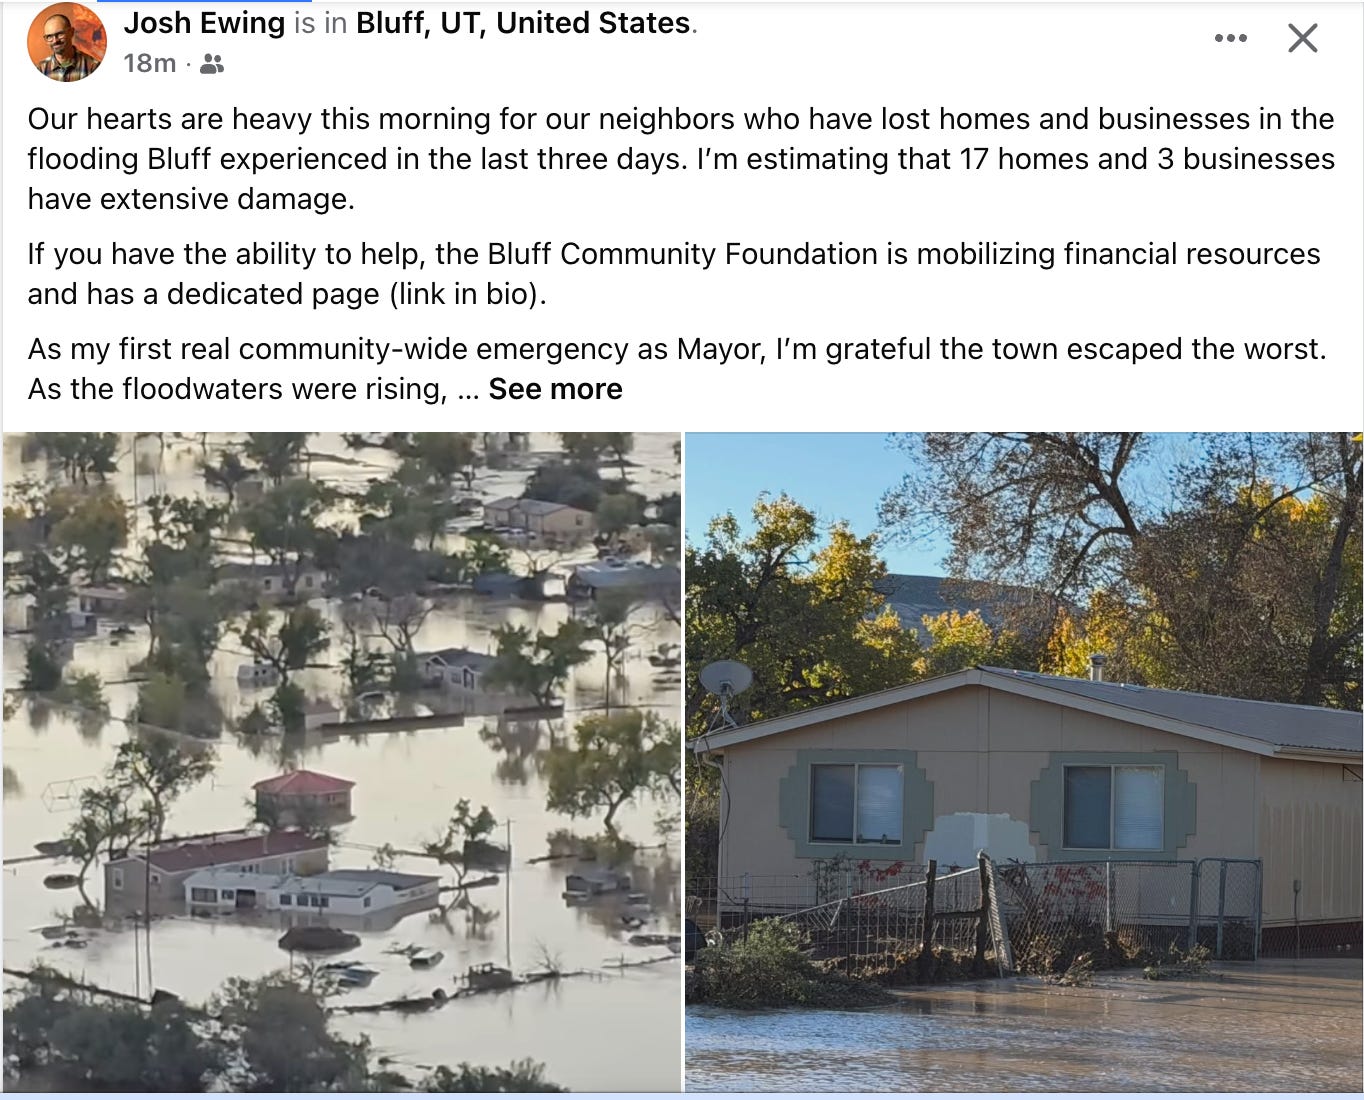
Past the Four Corners gage, this veritable wall of water was supplemented by McElmo Creek (which peaked during the storm at a very large 1,590 cfs), Montezuma Creek, and Recapture Creek before reaching Bluff. After breaching a wastewater storage pond for the town of Montezuma Creek, the waters continued onward, spreading out in the floodplain near St. Christopher’s Mission east of Bluff, inundating fields and homes, and then moving into Bluff’s fringe, where it also affected structures. In a Facebook post, Bluff Mayor Josh Ewing estimated that “17 homes and 3 businesses have extensive damage.”
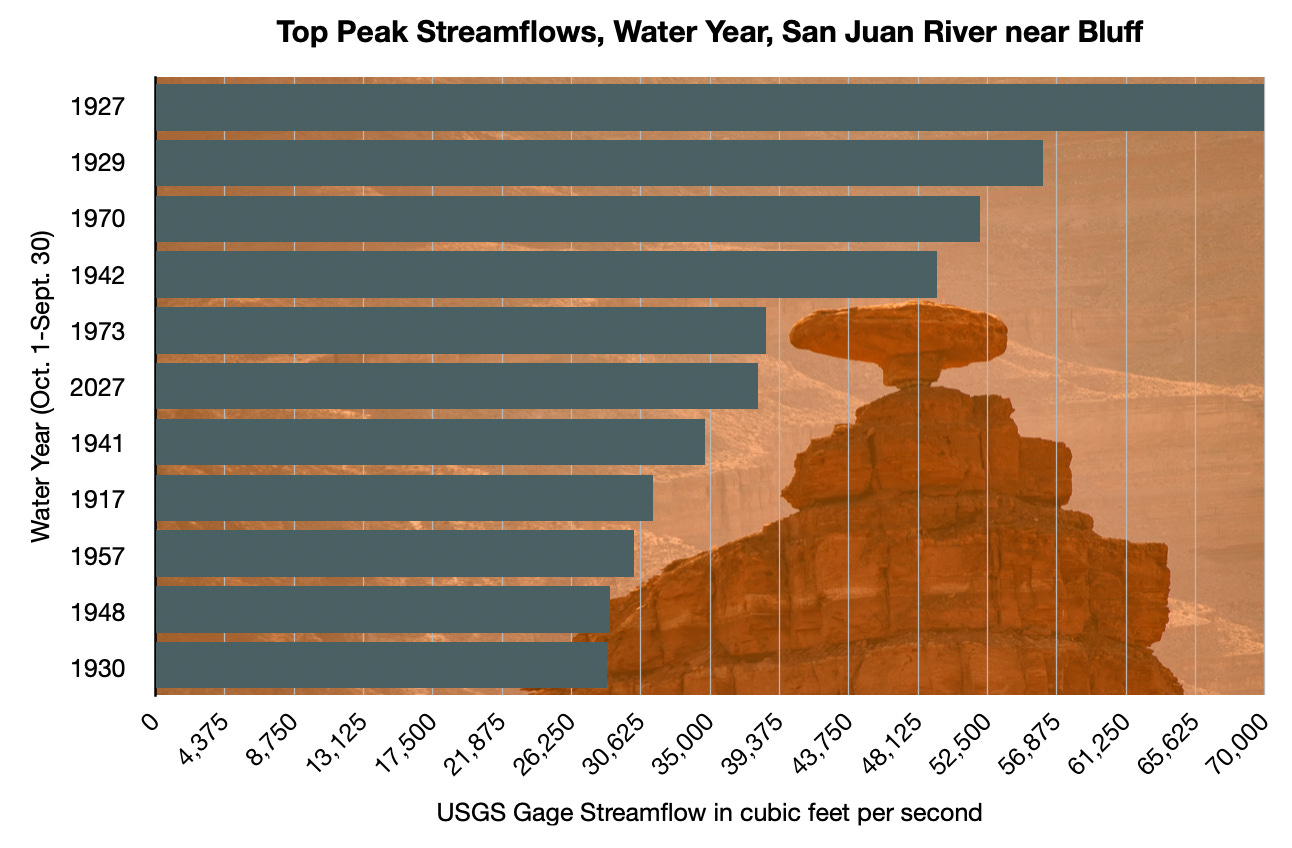
Downstream from Bluff, more tributaries add even more to the San Juan monster: Cottonwood, Comb, and Chinle washes and Lime Creek. However, by the time that pulse of upstream flows had reached this area, the rains had subsided along with those arroyos’ flows. So the USGS gage “near Bluff,” which is actually located at Mexican Hat, ended up peaking at 38,000 cfs on Monday at mid-morning. That actually puts this year’s peak (WY 2027 in the graph below) at 6th place since 1915. There was no gauge here during the 1911 Flood, but a USGS paleo-flood investigation concluded that the river that year reached about 150,000 cfs.
All of this is good for Lake Powell, of course. After reaching a record low of about 3,516 feet in mid-September, the reservoir’s surface elevation has jumped up to 3,527 feet, and will surely rise more as this San Juan River pulse reaches it in a few days. Whether this is just a temporary respite, or a more long-term salve for the Colorado River crisis depends on whether this El Niño-influenced moisture burst will continue into winter and transform from rain into the mountain snowpack on which the rivers rely.
For an in-depth look at the region’s floods from ancient times to today, check out this (newly updated) longform Land Desk piece from the archives, available exclusively to paid subscribers. But don’t get mad at the paywall, break it down for less than a cup of coffee a month and …

Thanks for putting this together, Jonathan. I’ve been watching this play out on the gauges, but your descriptions and graphs provide invaluable context for interested people to understand how these river systems work. Keep on keeping on with your fine reporting on our piece of the Plateau country.