Editor’s note: The Substack platform only allows so many words and images in each of these email dispatches. To see all of the images and the entire post, click on the “See More” button below, which will take you to the website (where you’ll have to click the button again to see everything).
⛈️ WACKY WEATHER WATCH⚡️
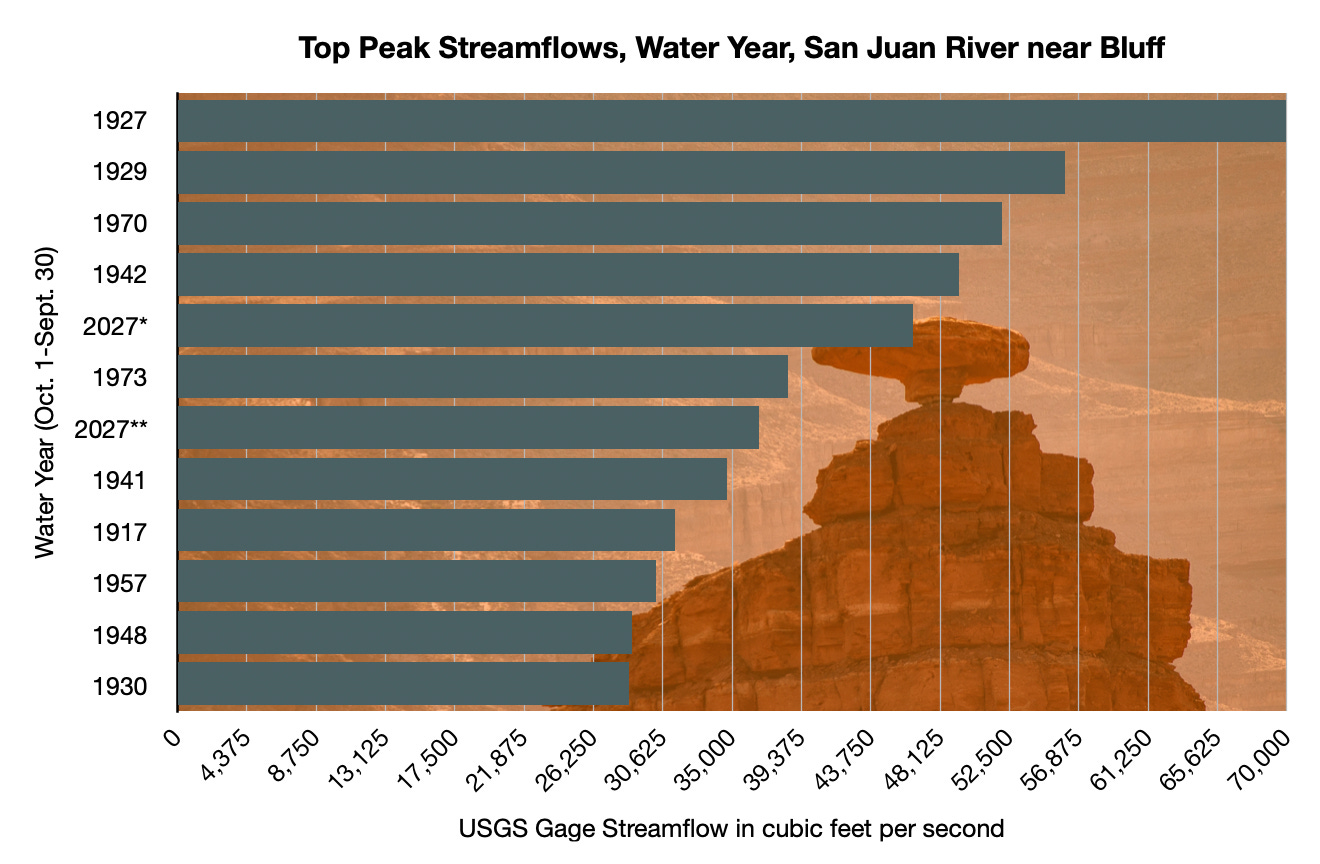
On the morning of October 26 — a few days after a huge storm had slammed the region — a USGS field measurement on the San Juan River at Mexican Hat, Utah, recorded a streamflow of 49,500 cubic feet per second, high enough to get within several feet of the iconic bridge crossing the river here, and to cause widespread flooding upstream in the community of Bluff, significantly damaging homes and businesses south of Highway 191.
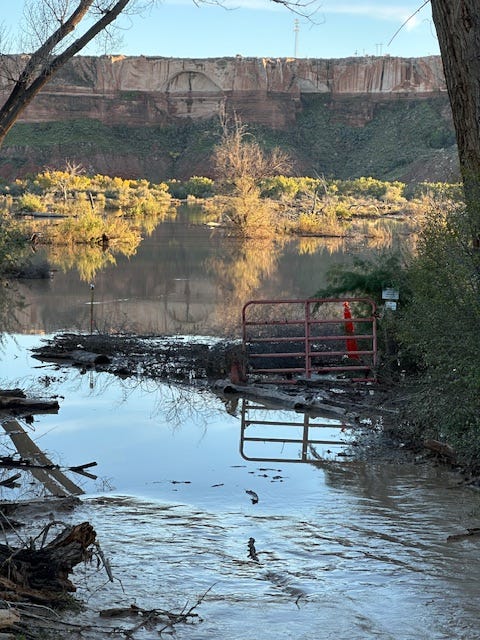
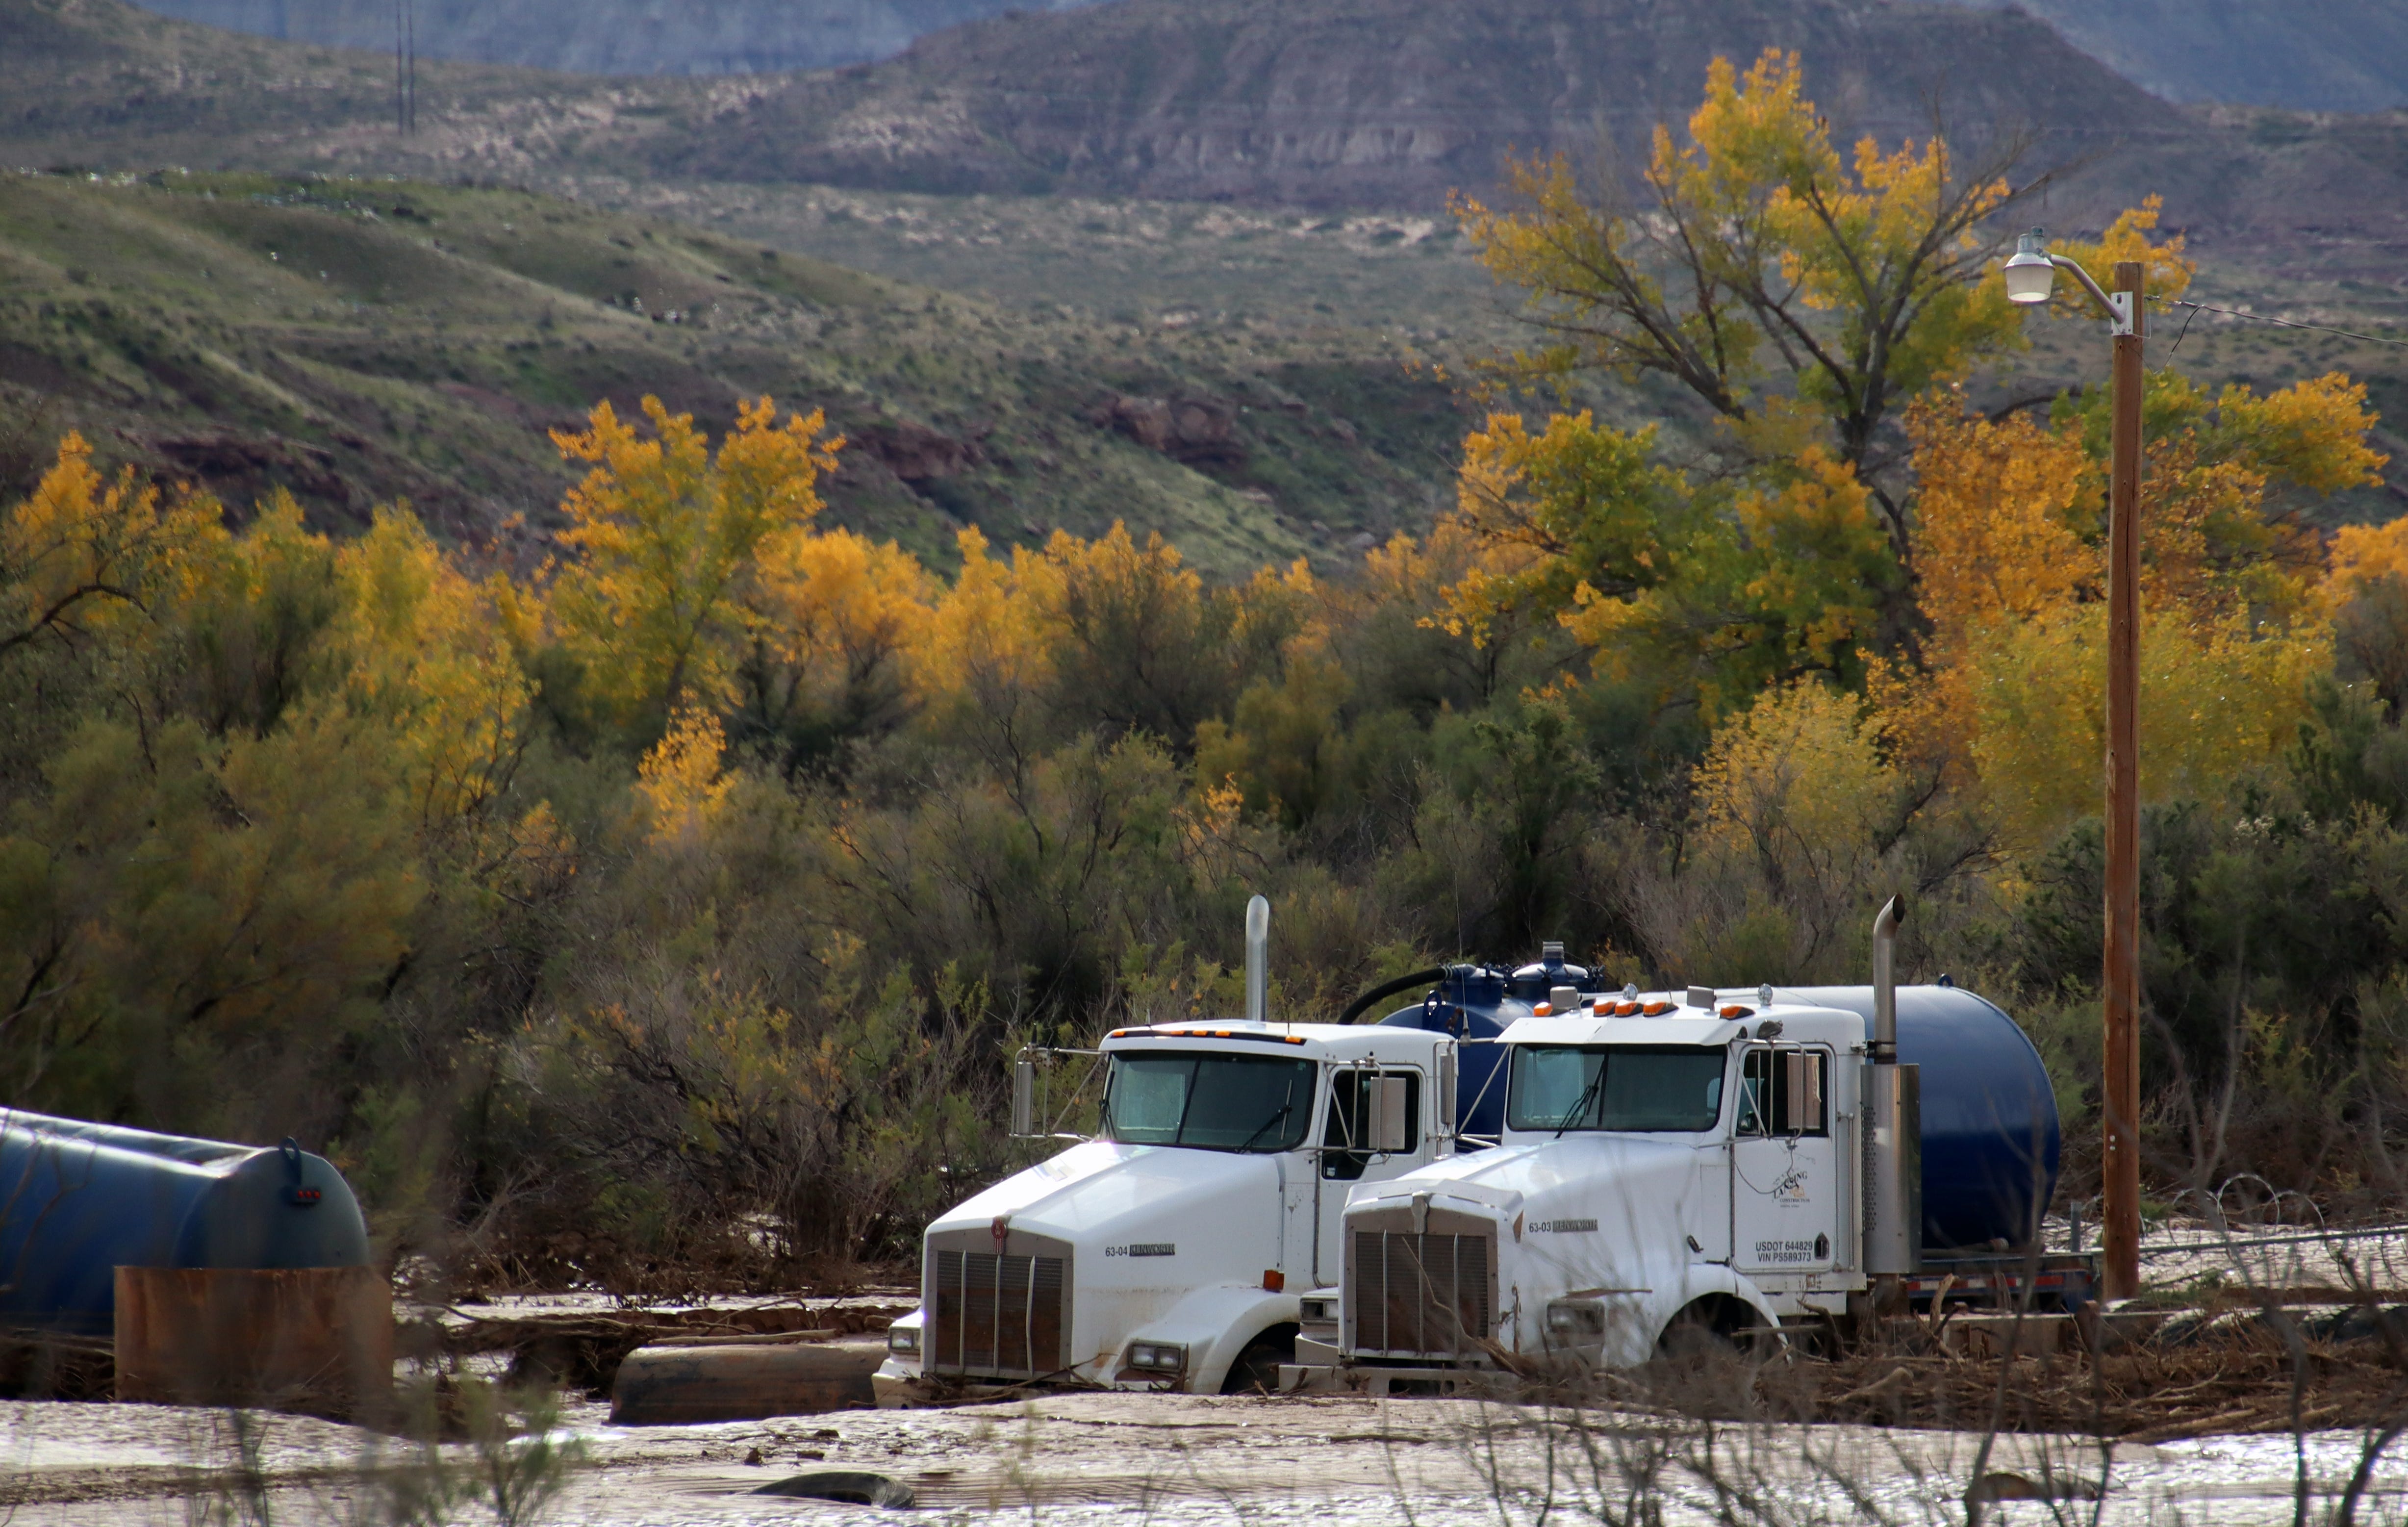
Less than a week later, another round of tropical moisture rumbled into the region, raising fears of a repeat. Residents thought they would have a little bit of time to prepare, however, since the peak pulse of the San Juan would take a few days to reach the desert town. Yet even as they anxiously watched the river slowly rise, Cottonwood Wash, an intermittent stream that gets its start in the Abajo Mountains north of town, became a river-sized monster that dug a new channel, scoured the canyon bottom, uprooted massive cottonwood trees and moved house-sized boulders, and backed up behind the highway bridge, causing water to flow into the north side of town and inundating homes, businesses, the post office, and the Bluff Fort.
My wife Wendy and I passed through Bluff a few days after the Cottonwood Wash flash flood after driving across a mud-mired Navajo Nation. The post office was still surrounded by several inches of mud and water, a stack of waterlogged and red-brown-stained mattresses were piled up outside a lodging establishment, and three women in mud-spattered hazmat suits and masks sat by the road next to a still-inundated home. We stopped by Cow Canyon Trading Post to see how the proprietor, Liza Doran, was doing. The place is located such that it was mostly unscathed by either the San Juan or the Cottonwood flooding, but the trauma of repeated evacuation notices, uncertainty about when or from where the next deluge might come, and from seeing so many neighbors suffering, was palpable.
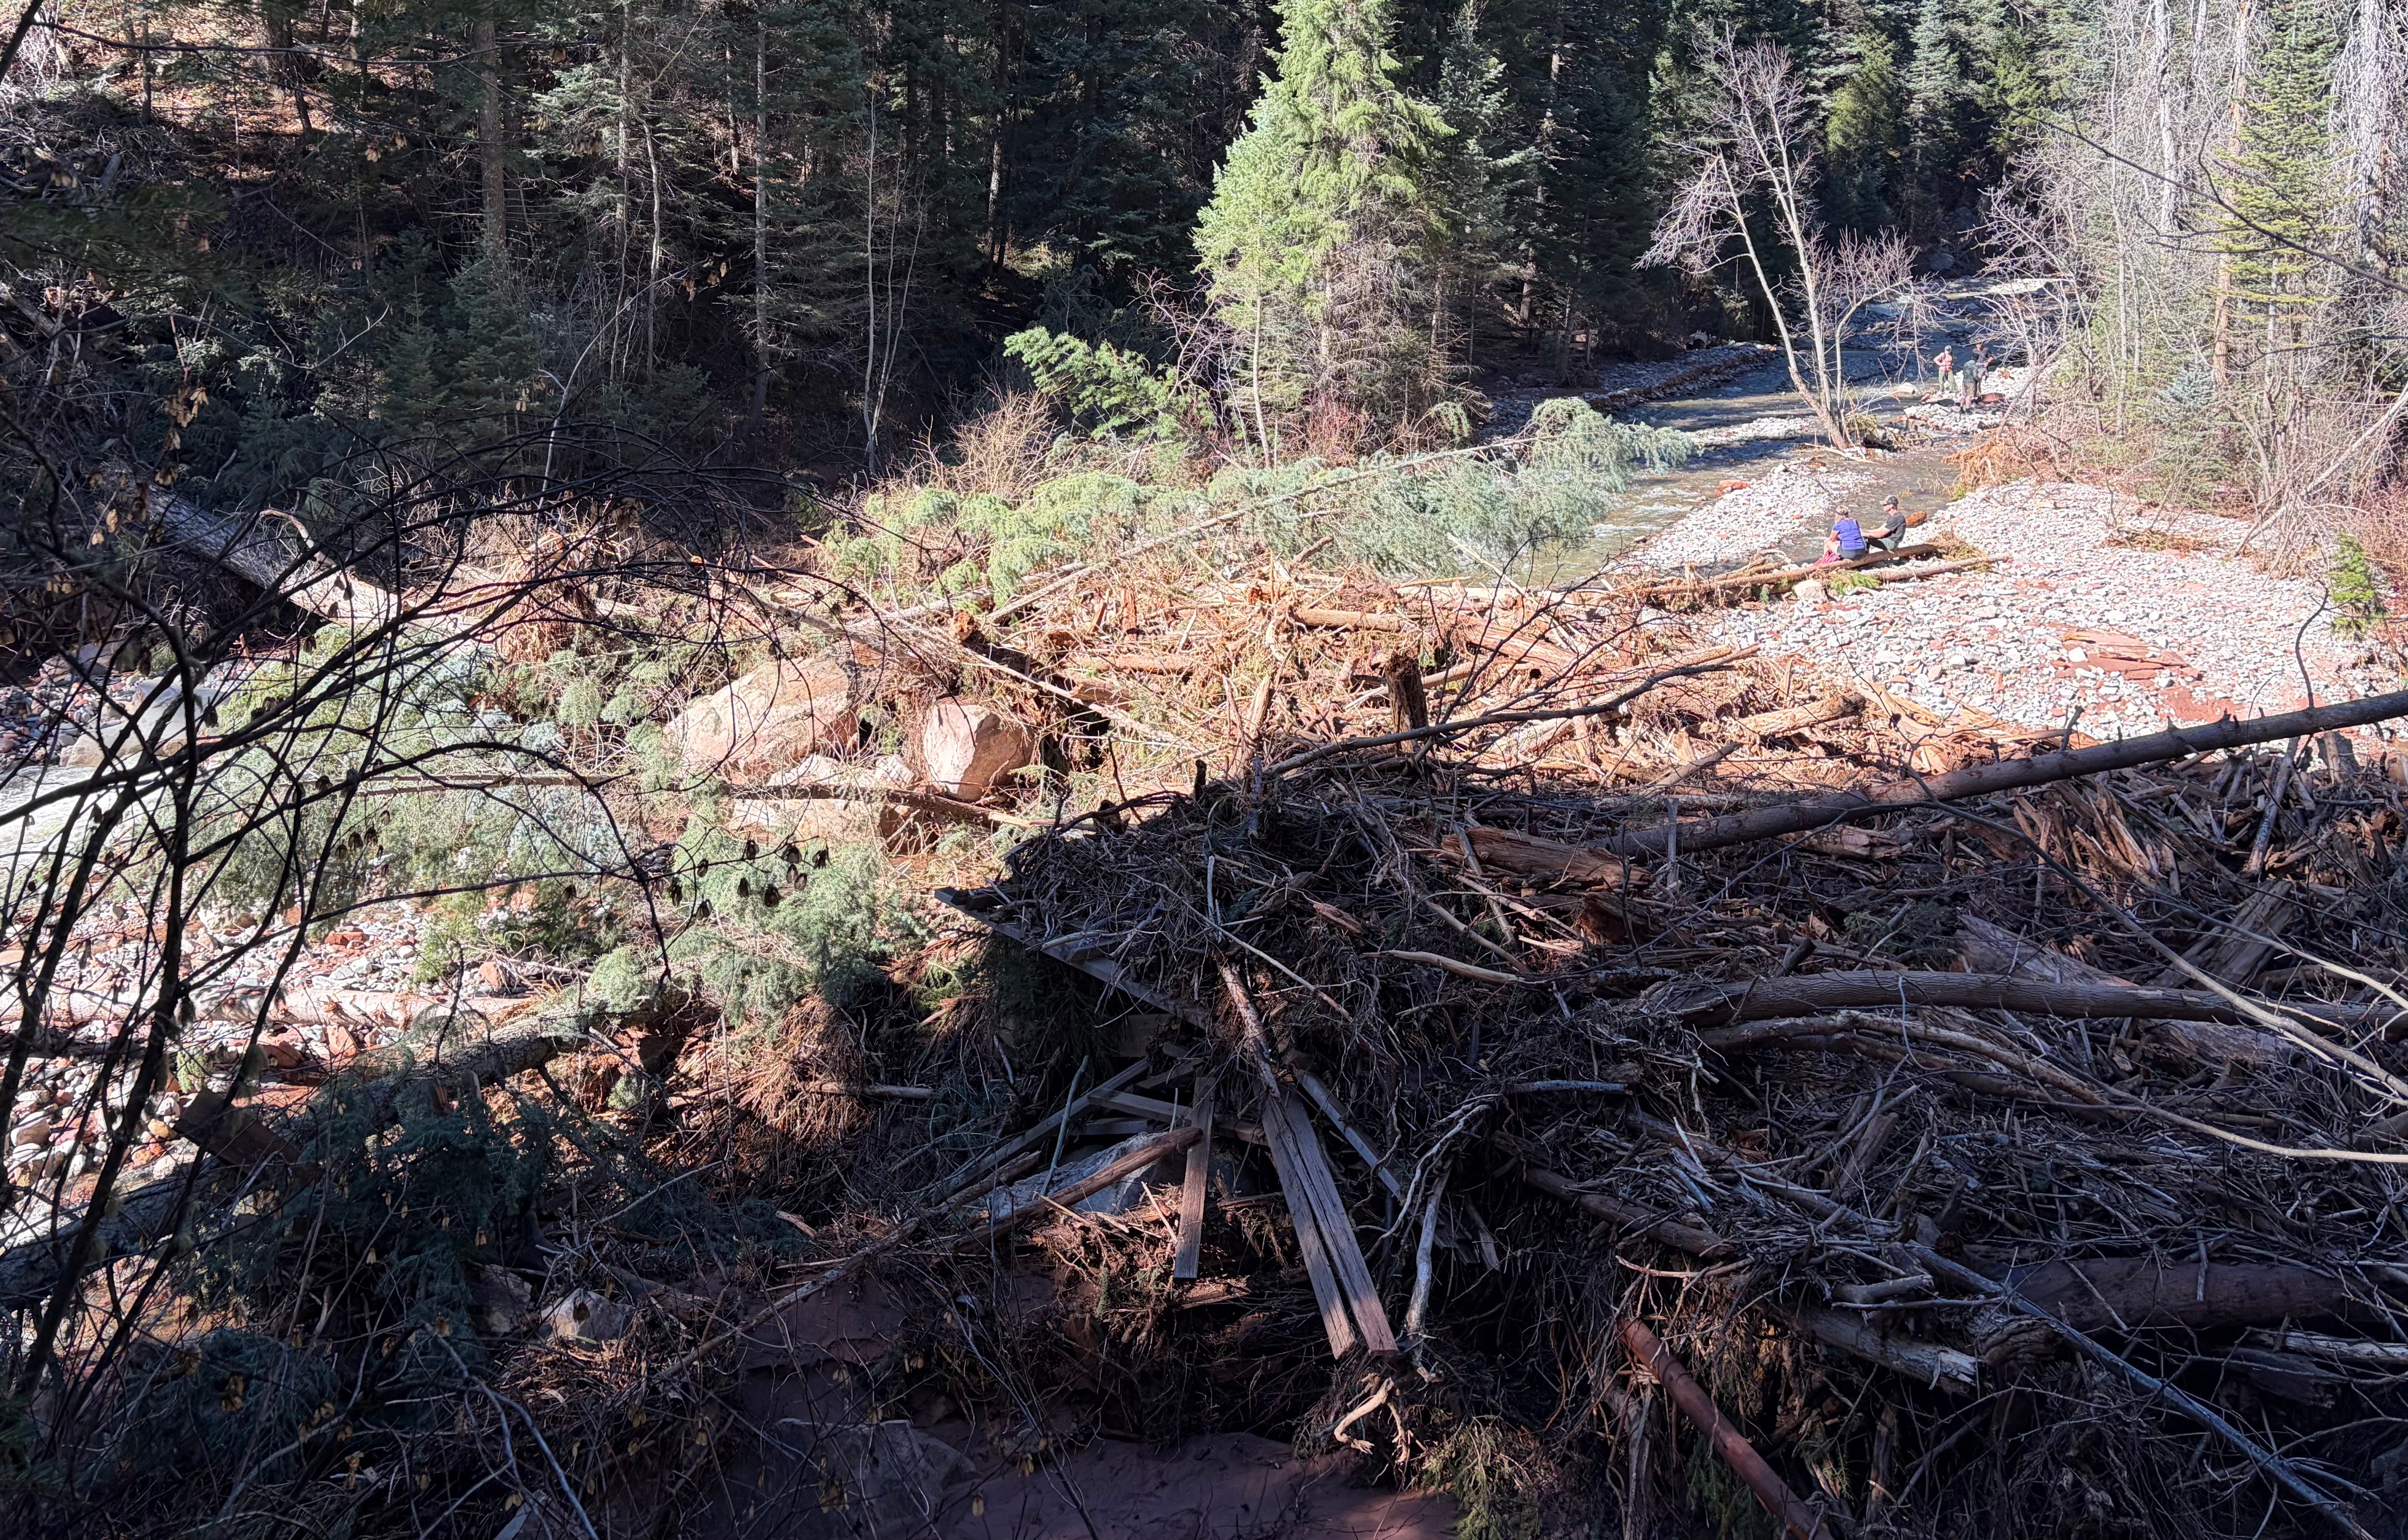
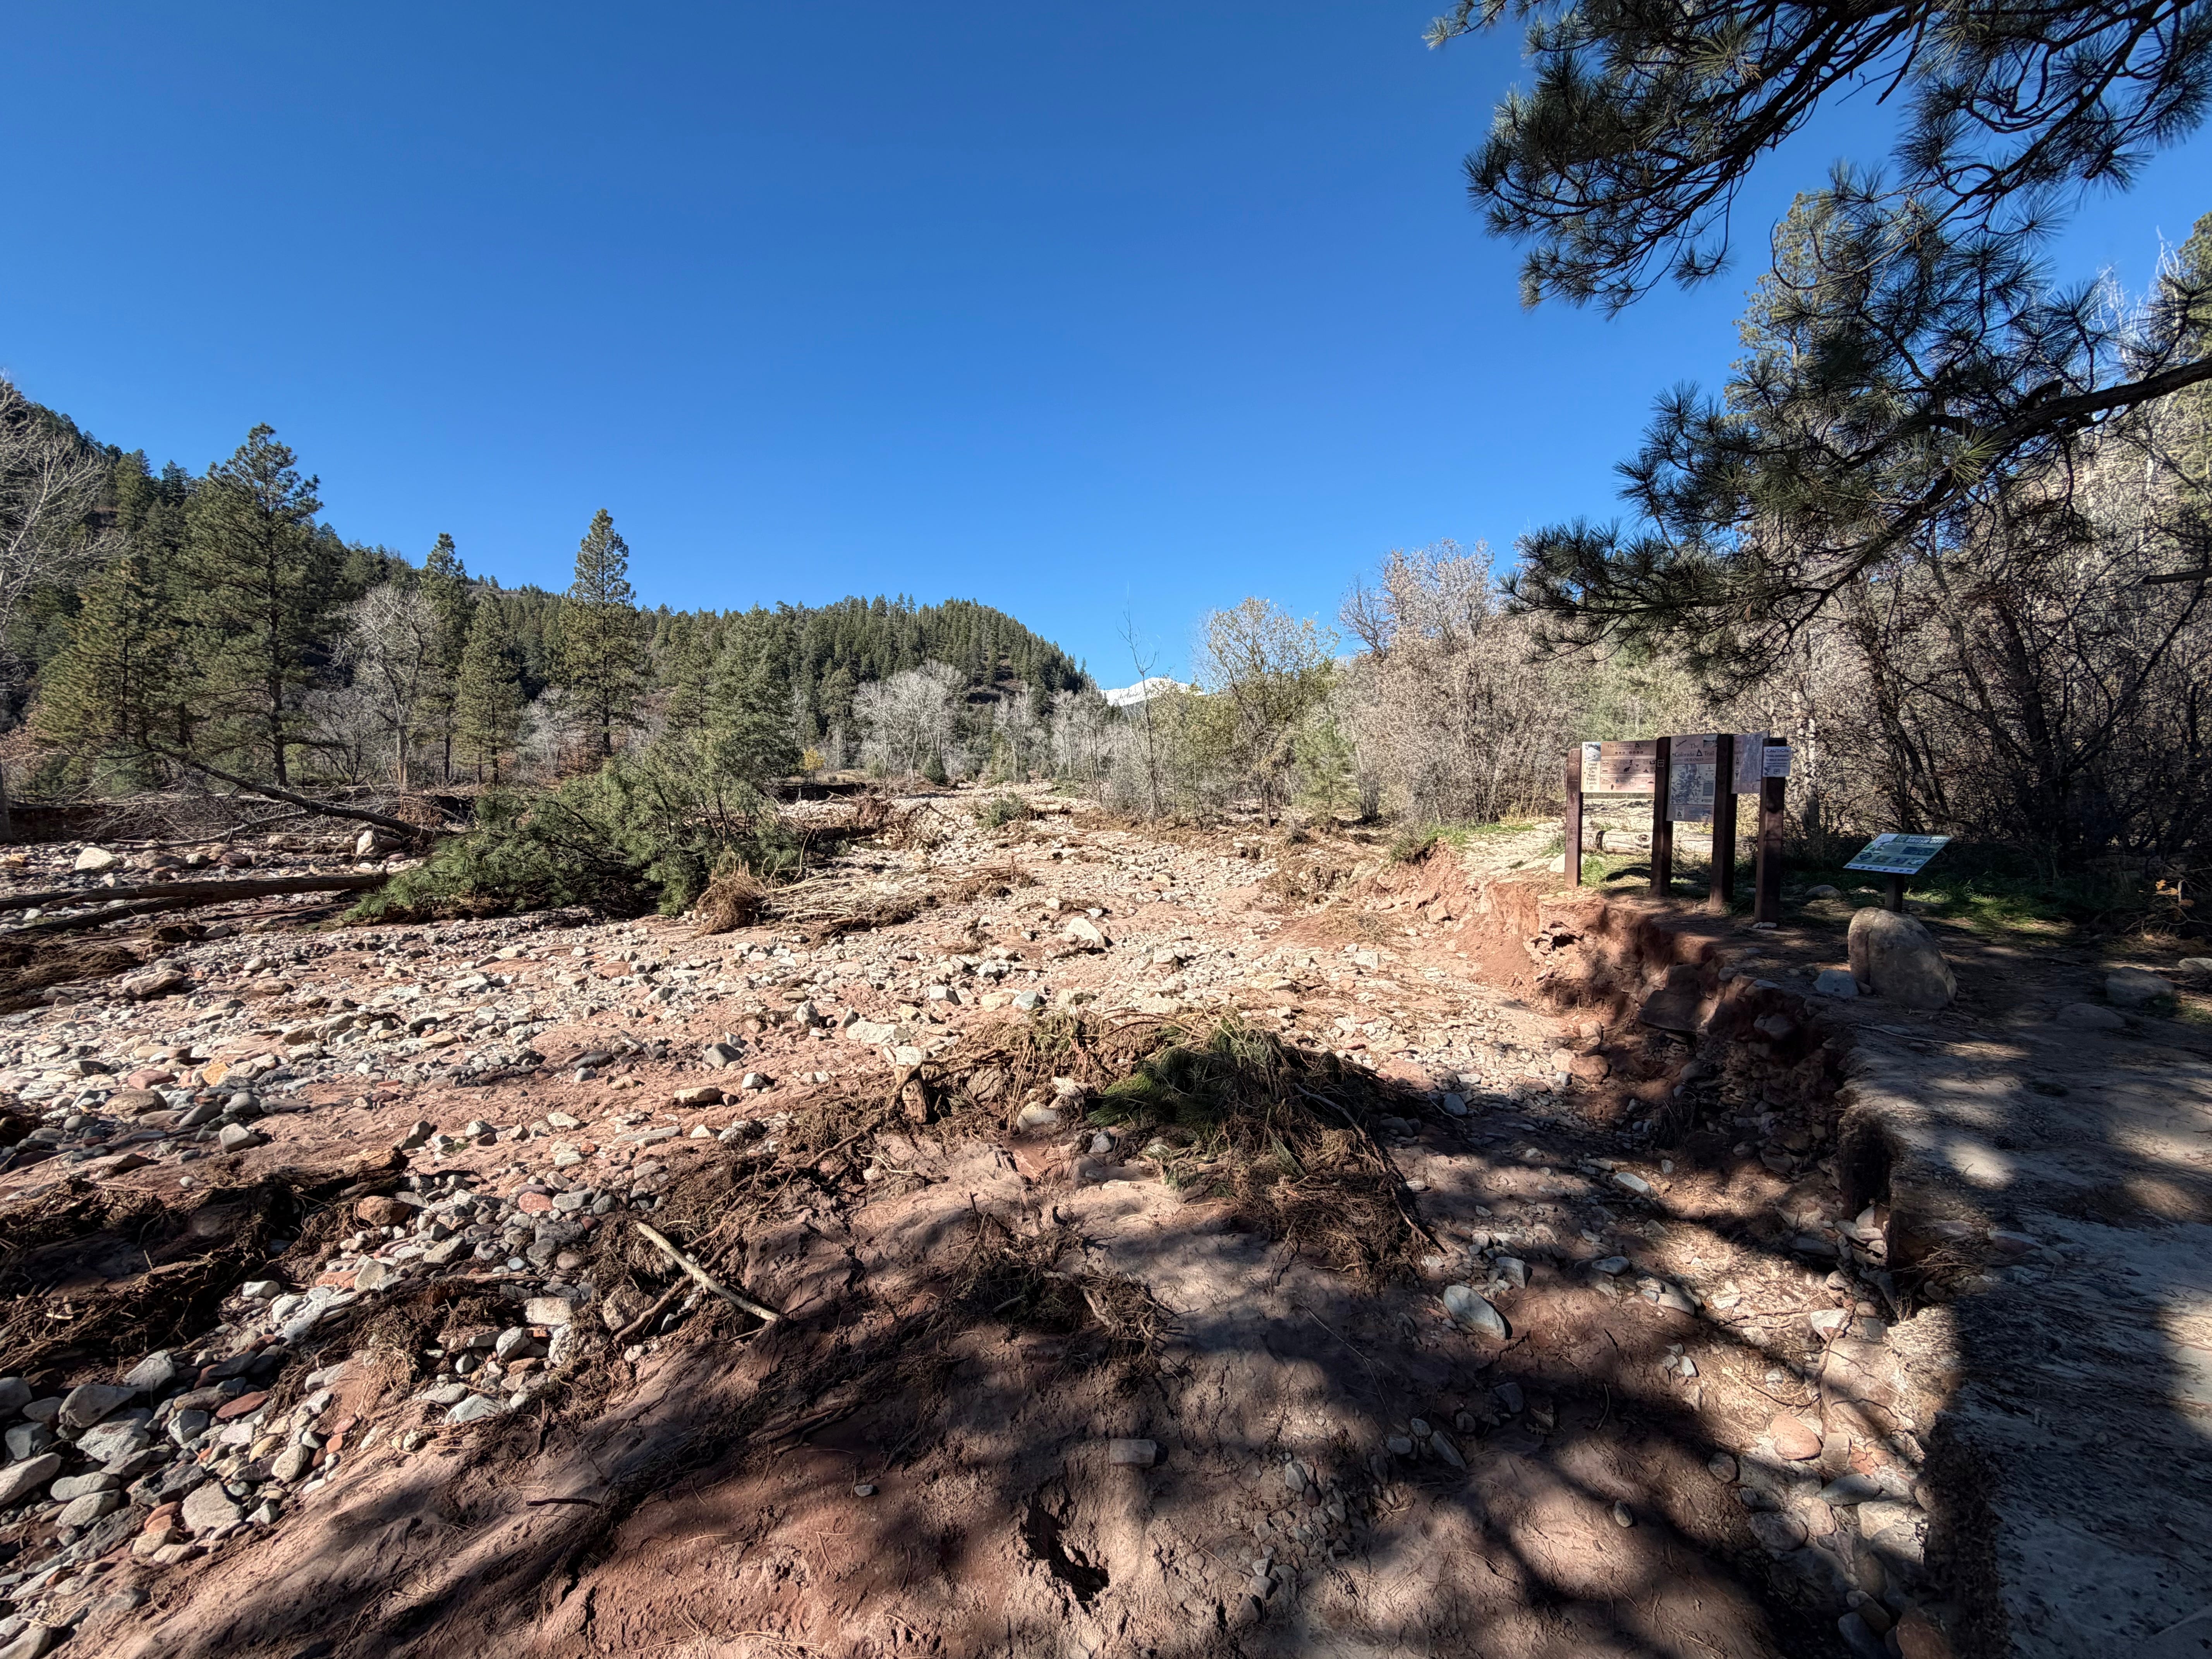
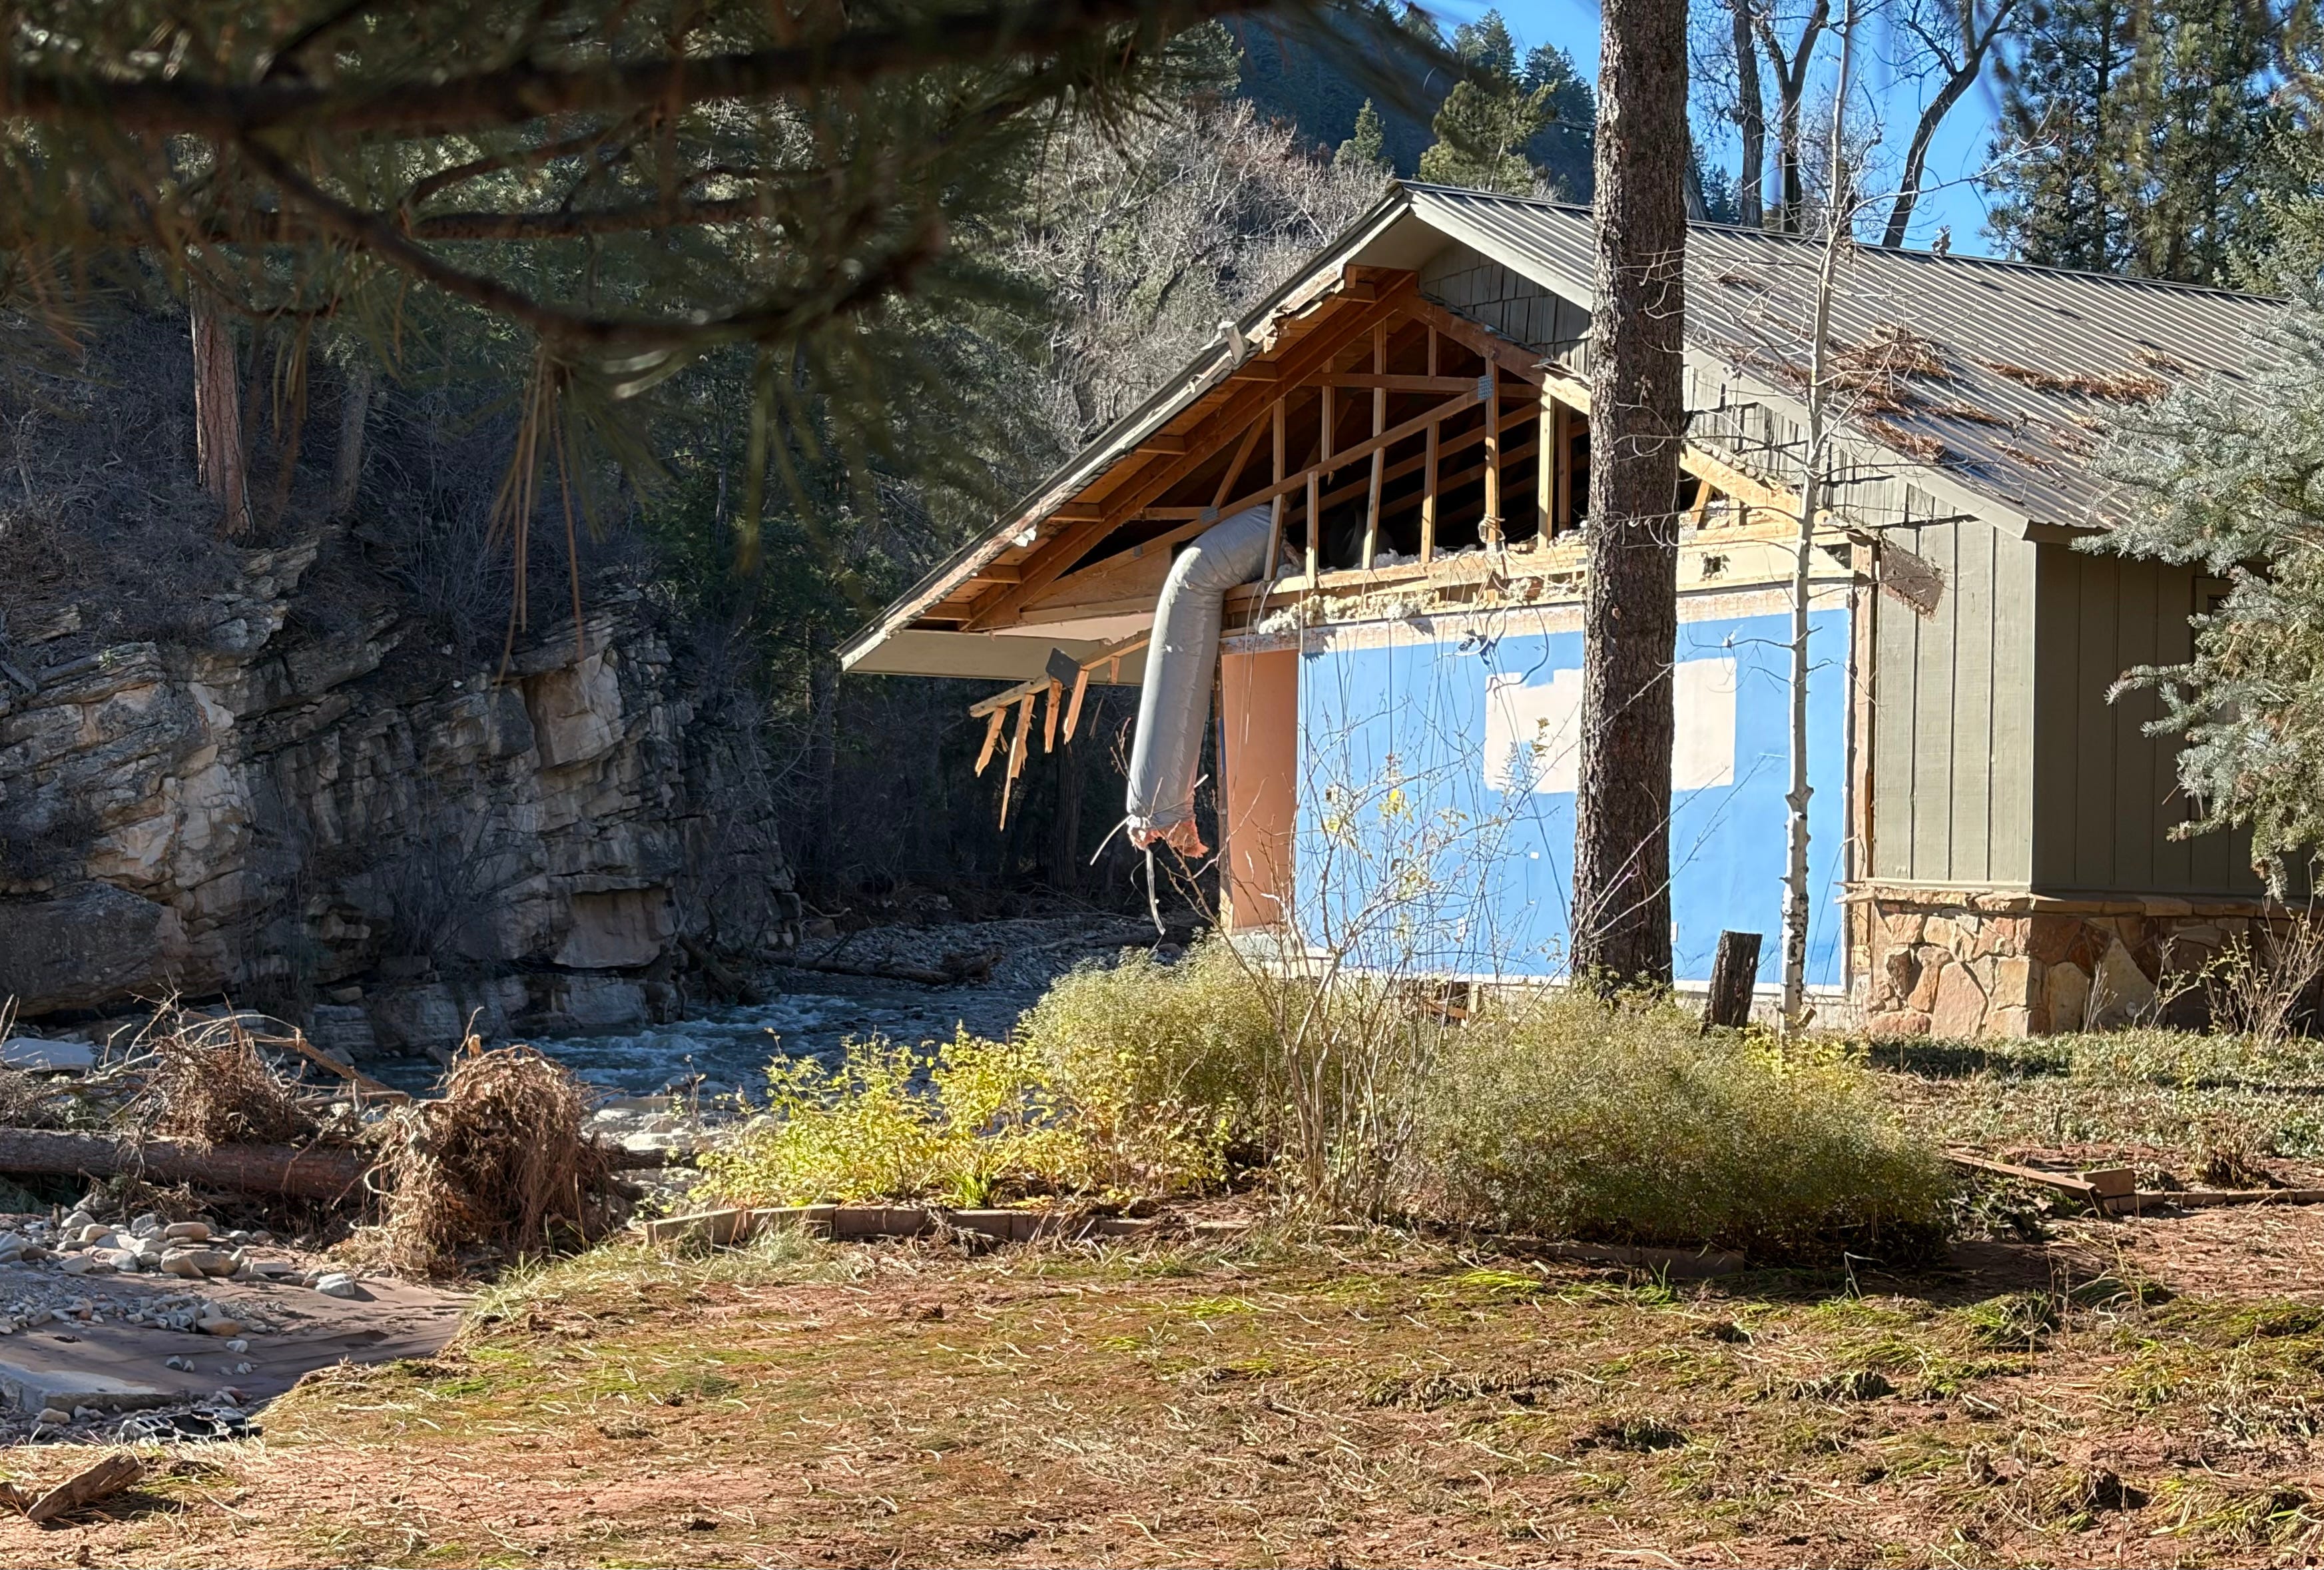
The tragic and devastating scene was repeated in various levels of severity across the Four Corners Region, from the Verde River Valley in Arizona, to Pagosa Springs and the San Luis Valley in Colorado, to Rock Point on the Navajo Nation, to the Hermosa and Junction Creek drainages near Durango. The raging water wrecked or soaked hundreds of homes, washed out roads and bridges, destroyed trails, and deposited tons and tons of silt and mud — often contaminated with raw sewage — in homes and on lawns and streets.
Mucking out and making repairs will take months. The psychological toll, meanwhile, will linger indefinitely. We all must reckon with the fact that this place we call Home, and the very things that draw us to it — the burbling brook up the road, the sparkling waters of the river in which we find solace, the gorge in which we hike — also carry violence and the power to reshape the landscape and, yes, destroy our homes.

📈 DATA DUMP 📊
Comparing this year’s floods to past ones in the Four Corners Country isn’t as straightforward as I would like it to be: Some critical streamflow gages don’t go back far enough to offer a full historic picture, and even when they do it’s not always clear that some of the older records are accurate. Even the most recent floods knocked some of the gages out of commission, leaving the actual peak flows a mystery.
Also, there’s only so much the numbers — whether it’s precipitation amounts, gage height, or streamflow — can tell us about the actual severity and impact of the floods. There are far more human-made obstructions in the streambeds now than there were in, say, 1911, which can exacerbate the effects. North of Durango in the Animas Valley, for example, some of the most significant impacts came from debris getting caught under the railroad bridge across Hermosa Creek, creating a dam that diverted much of the swollen stream directly into residential areas. In the case of Durango North Village, a mobile home park, Highway 550 ended up acting like a dam, trapping the murky water in the neighborhood and allowing it to masticate the homes.
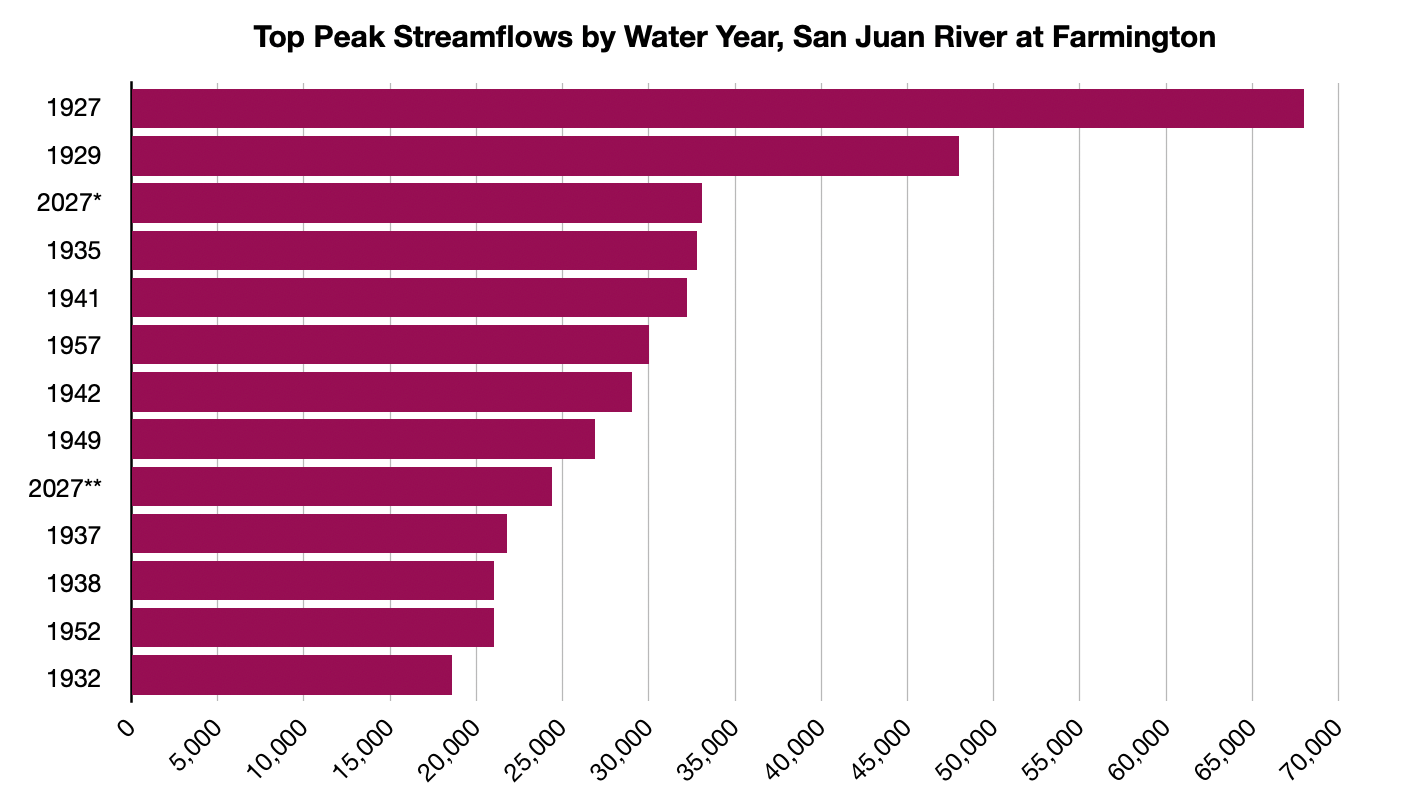
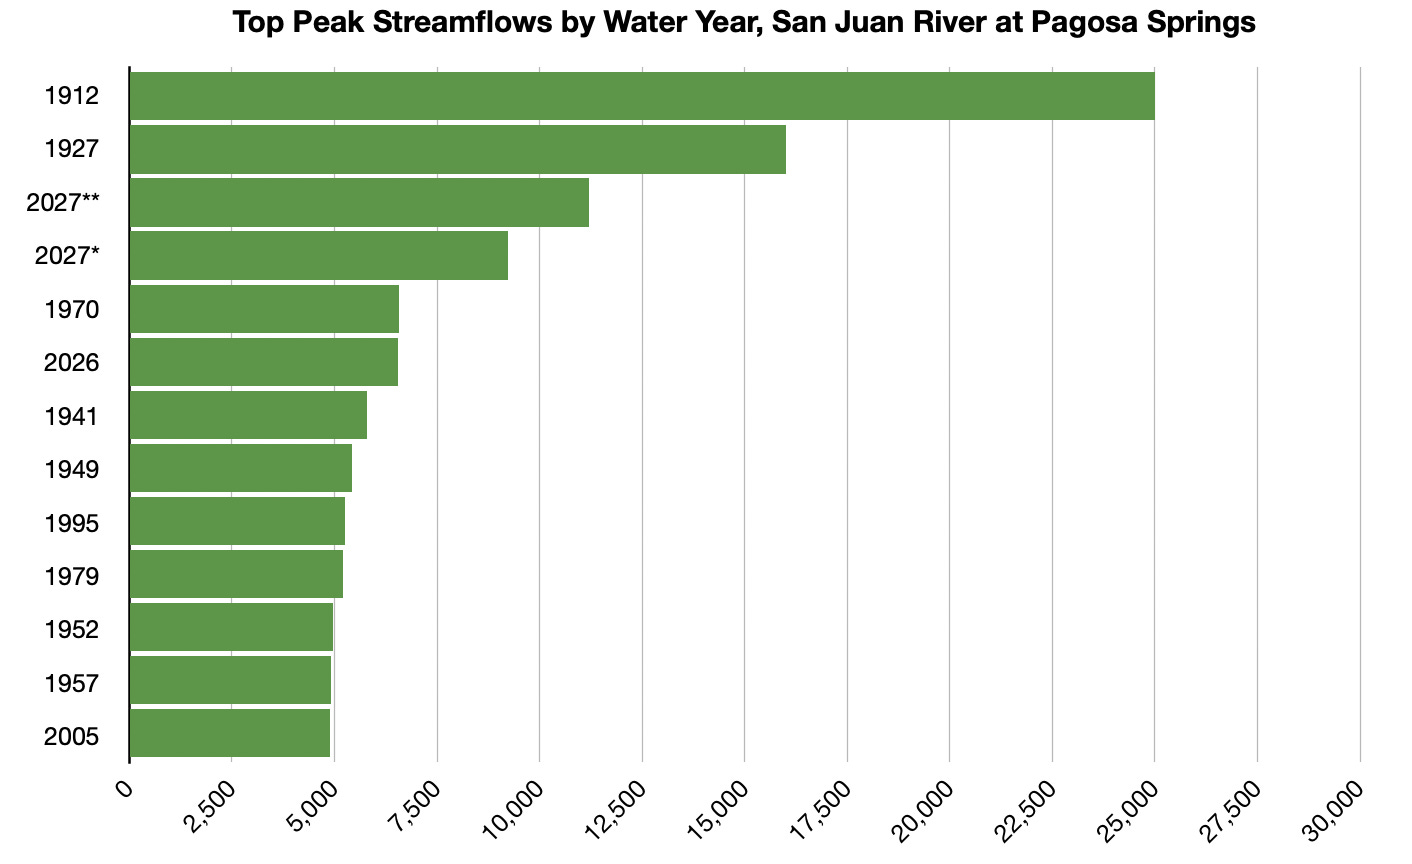
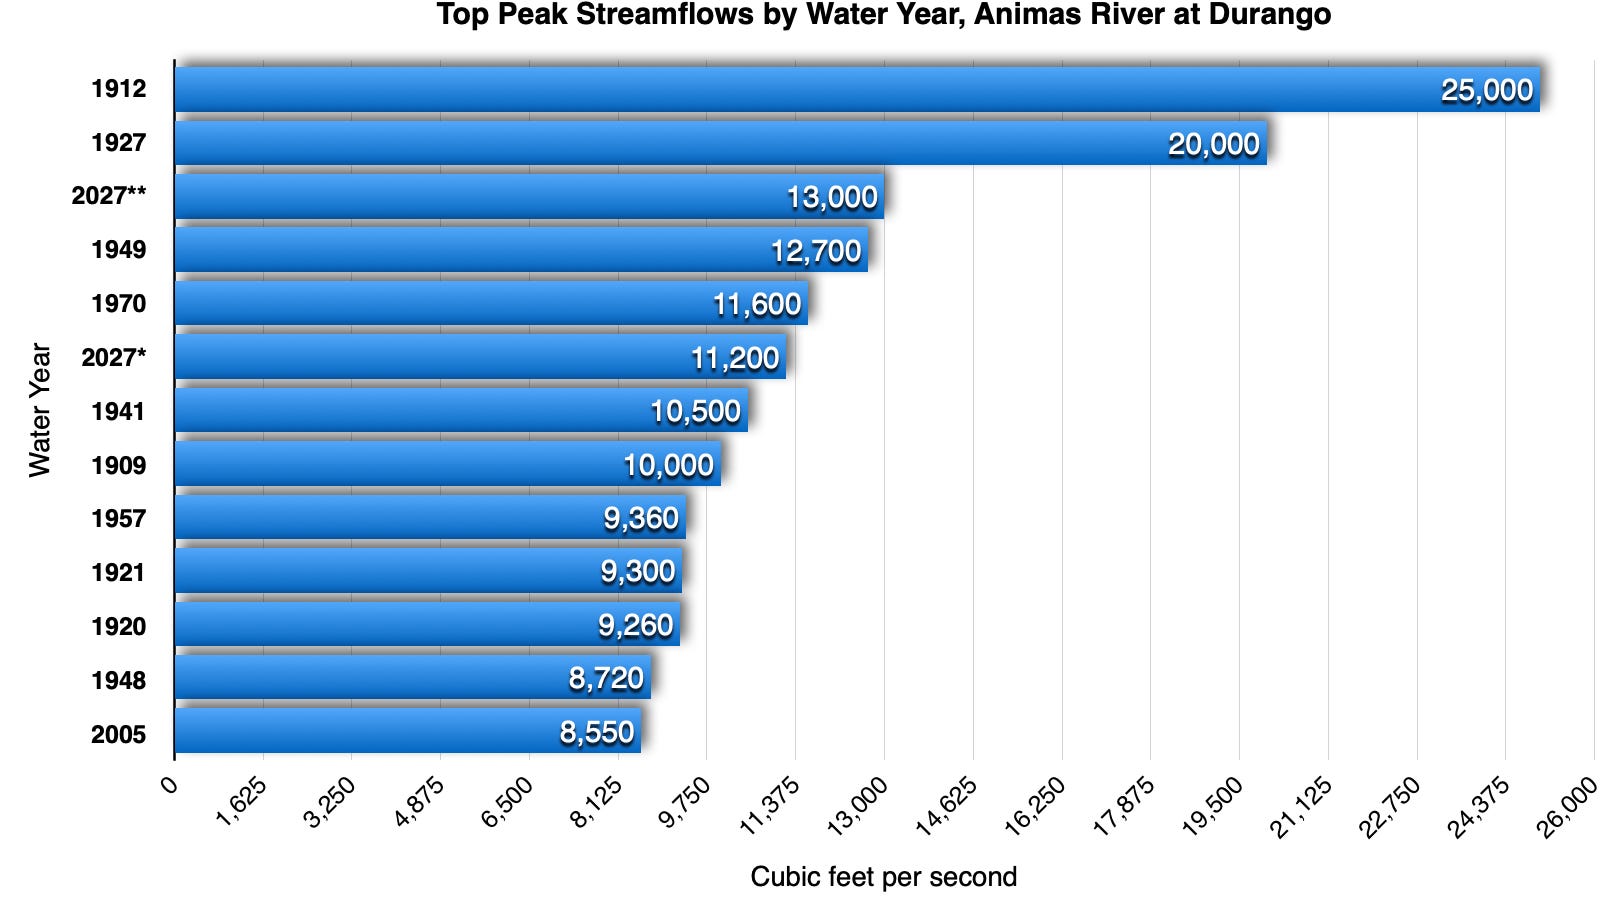
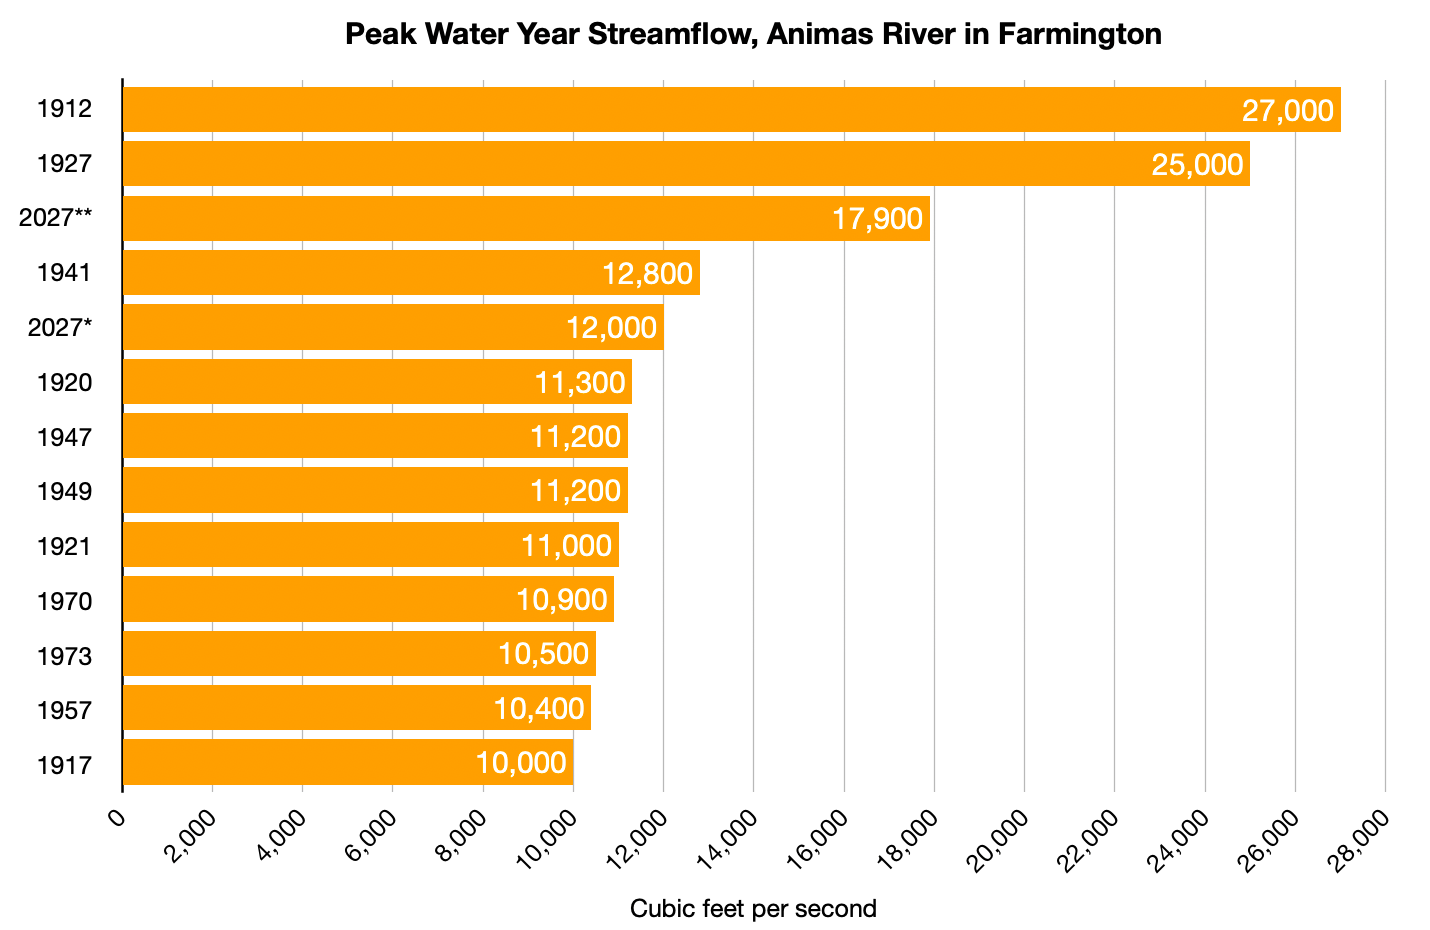
Judging merely from the data available to us, however, the October and November 2026 floods were not the largest to hit the region since the beginning of white settlement. But from what I can tell, this may be the first time on record that the region has been hit by three consecutive extremely high water events within the period of one month.
One thing is clear: It has been a wet autumn around here. Really, there have been at least four major rain events this fall. The first was in mid-September, which caused some flash flooding and brought streams up from all-time lows, and the second was in mid-October, when I marveled at rivers reaching 2,000 cfs. Those seemed like some serious storms and streamflows at the time, but they were humbled by what followed on October 23 and then Nov. 1, which led to actual flooding.
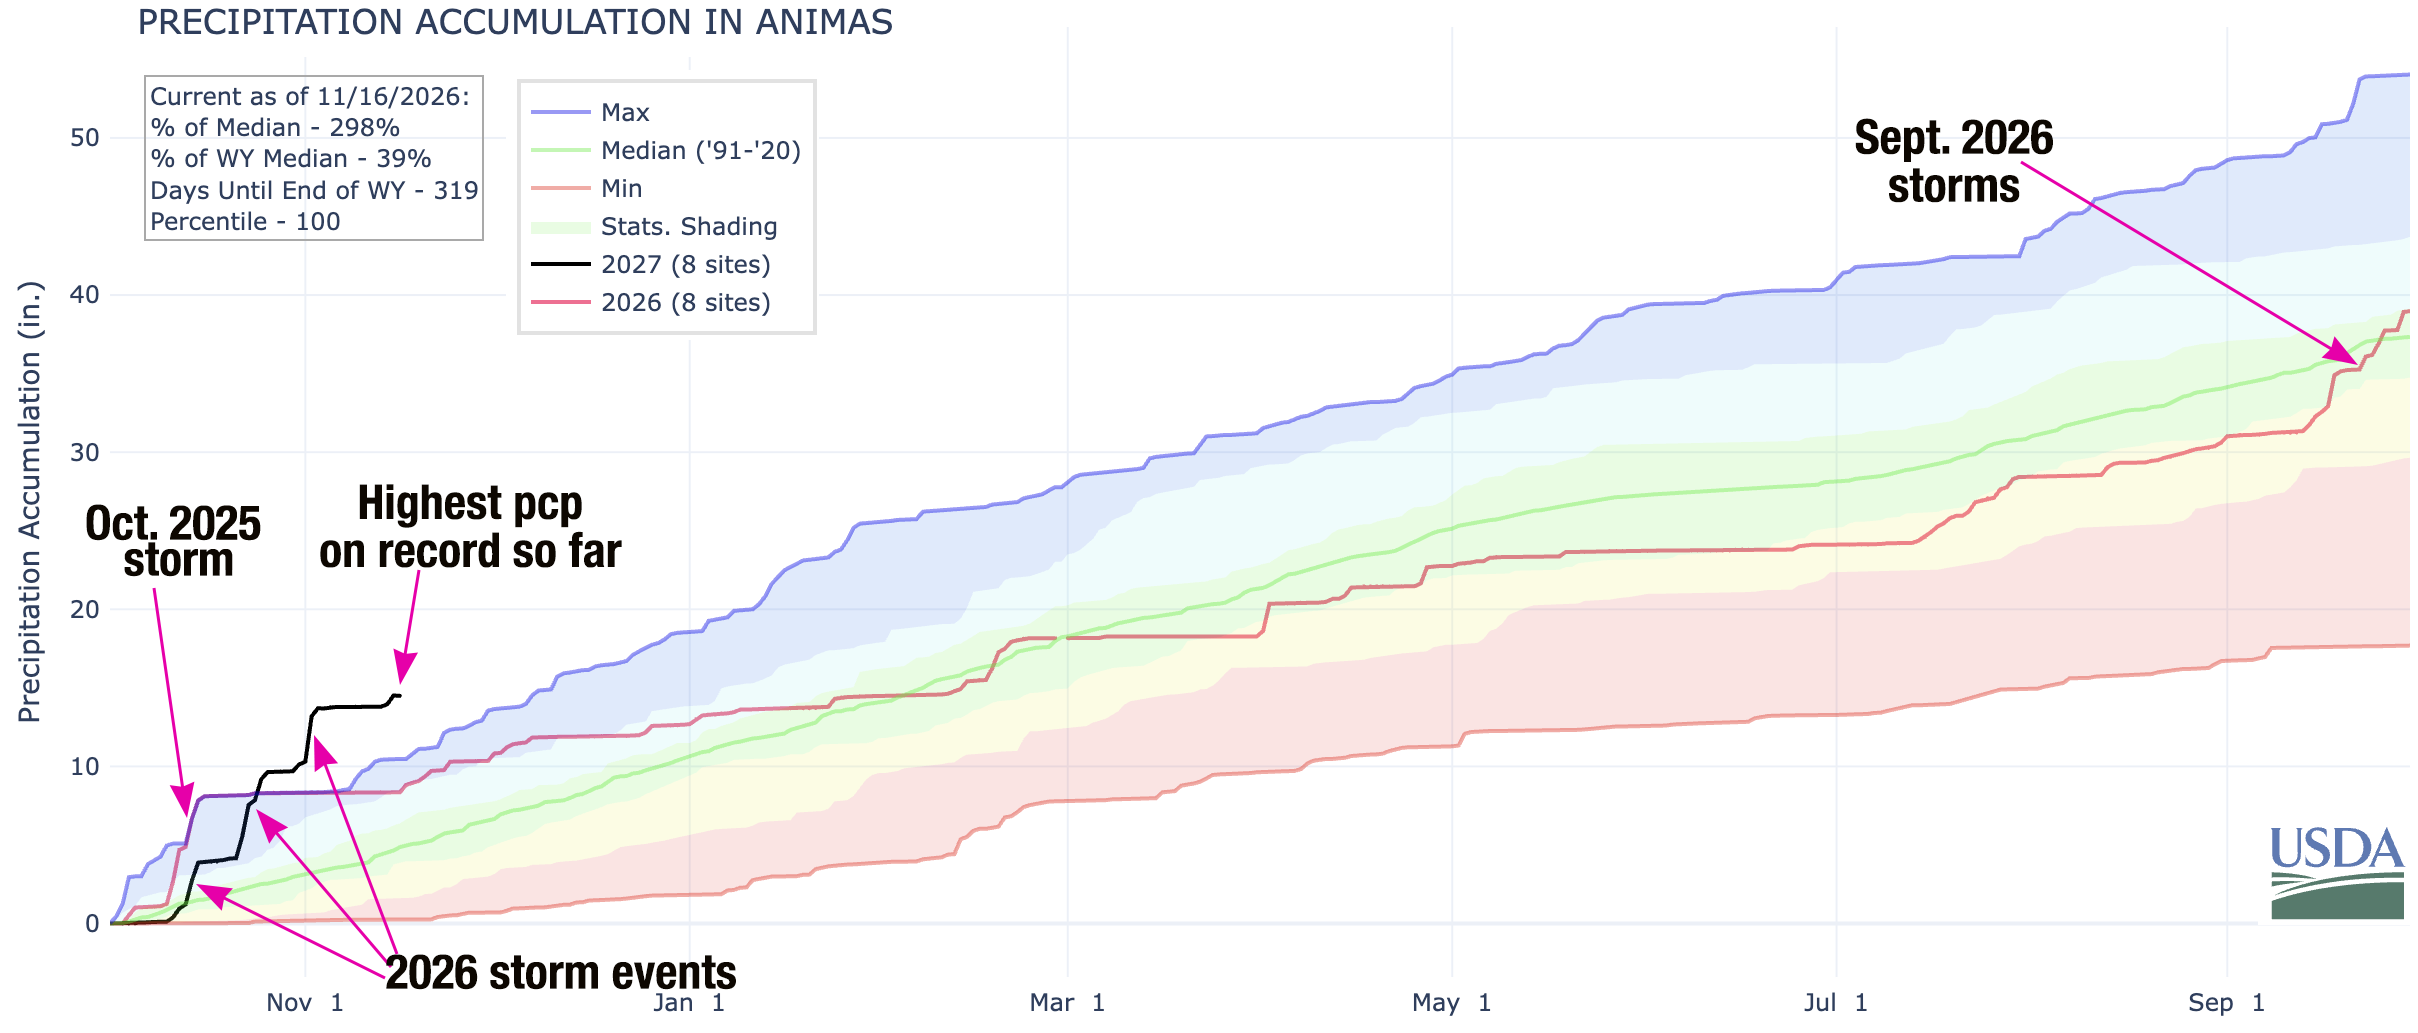
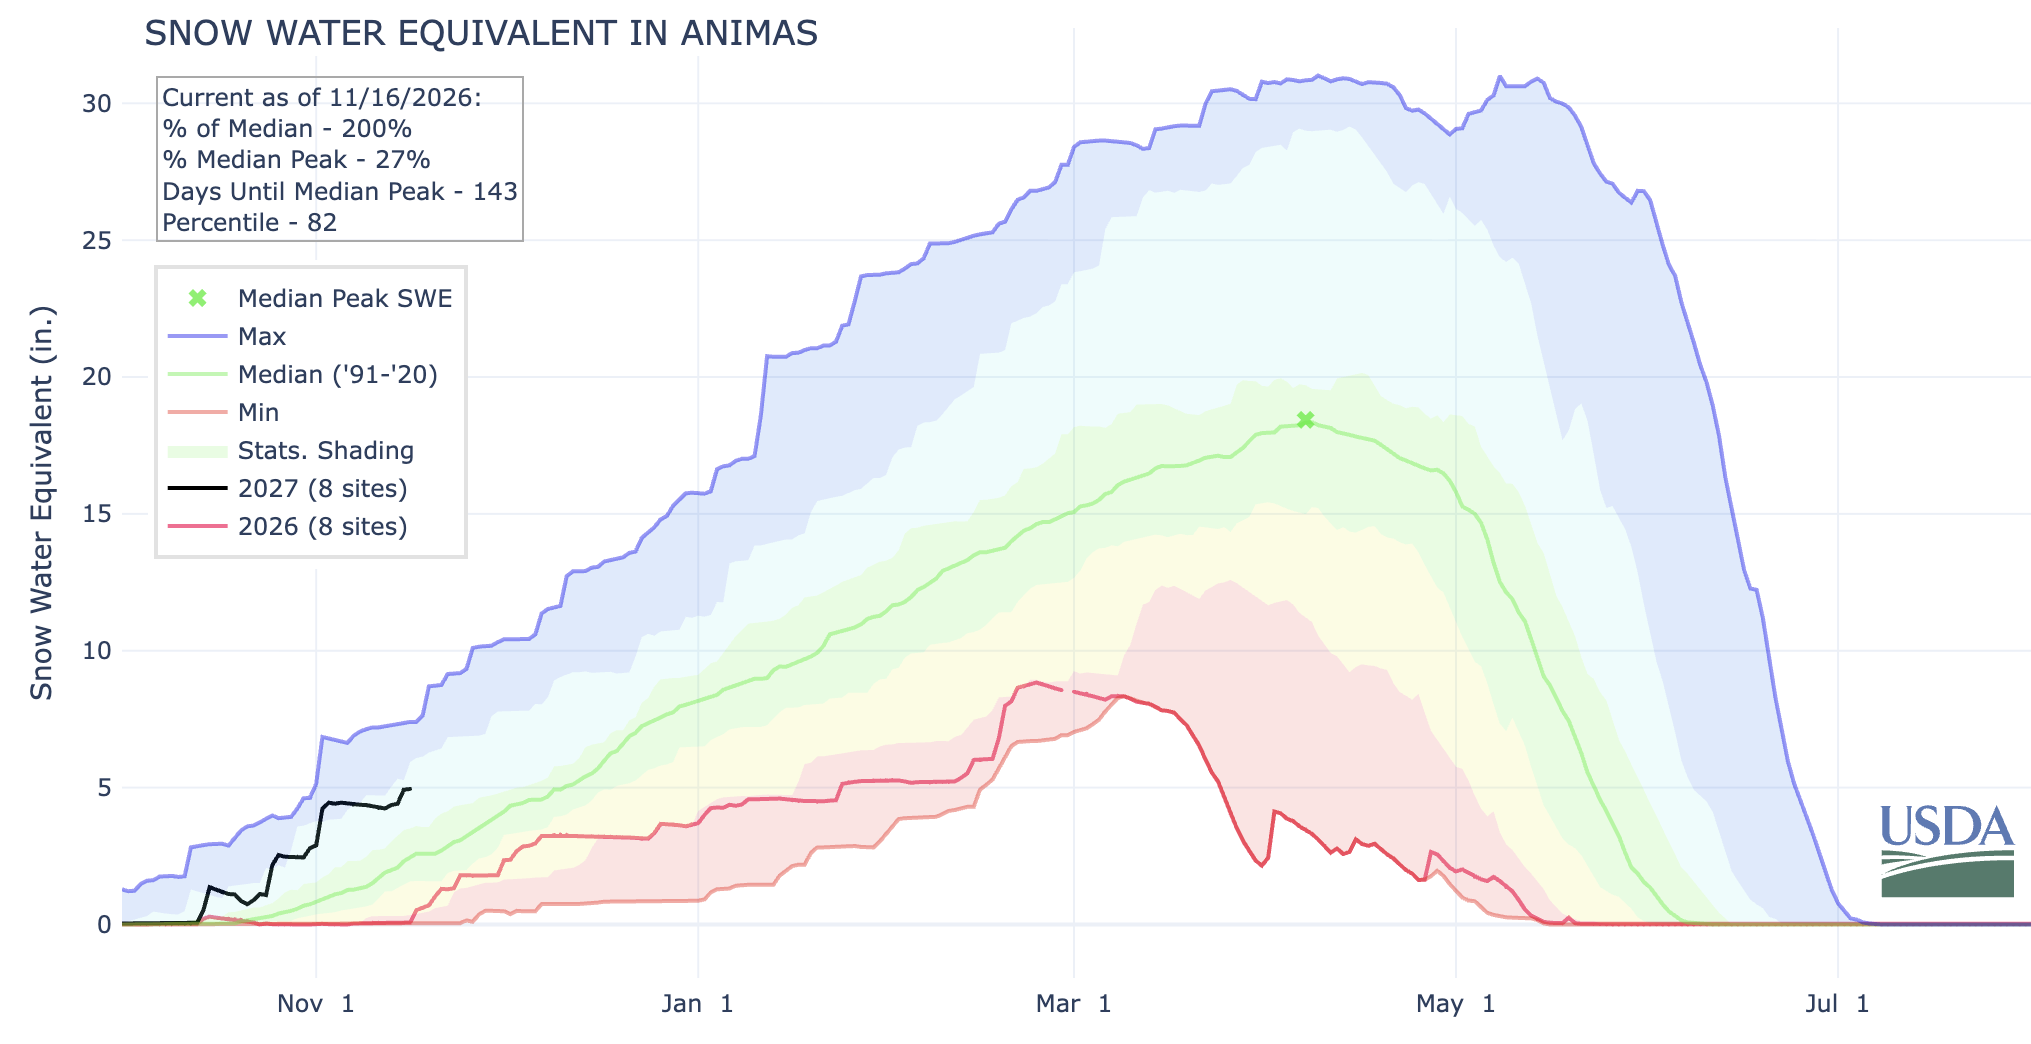
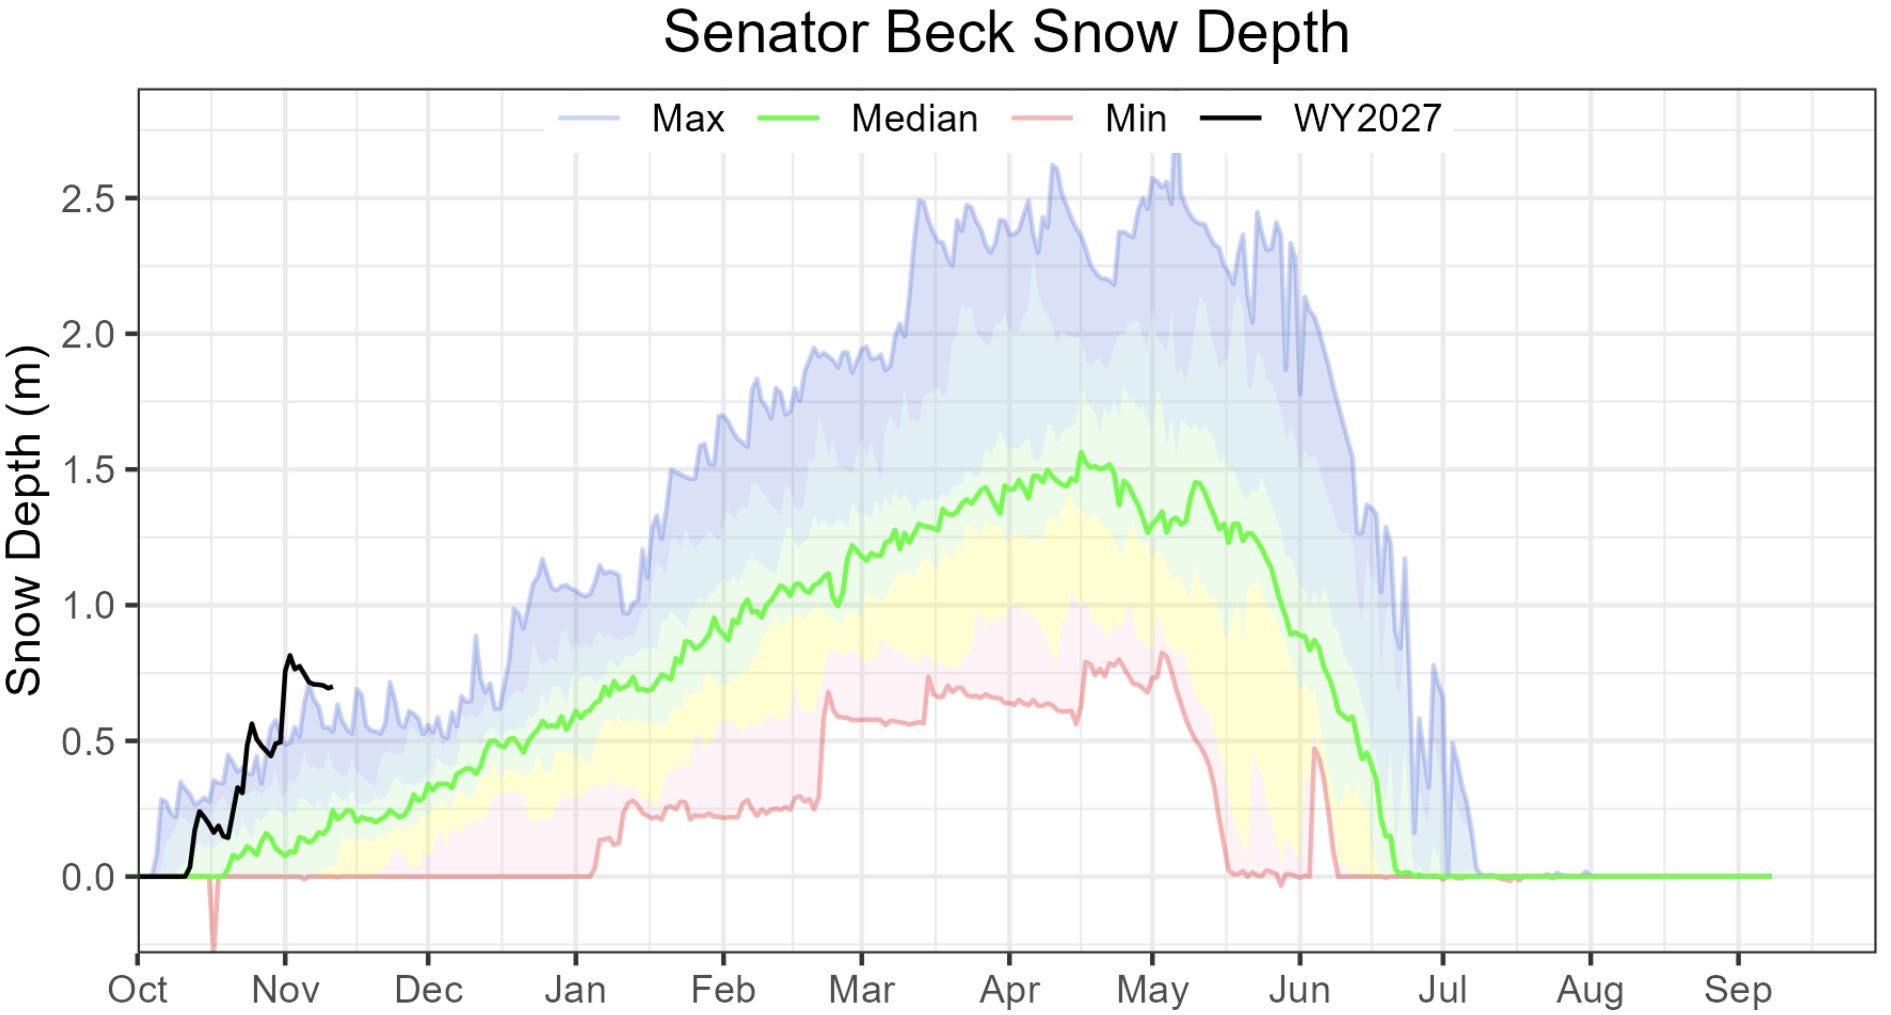
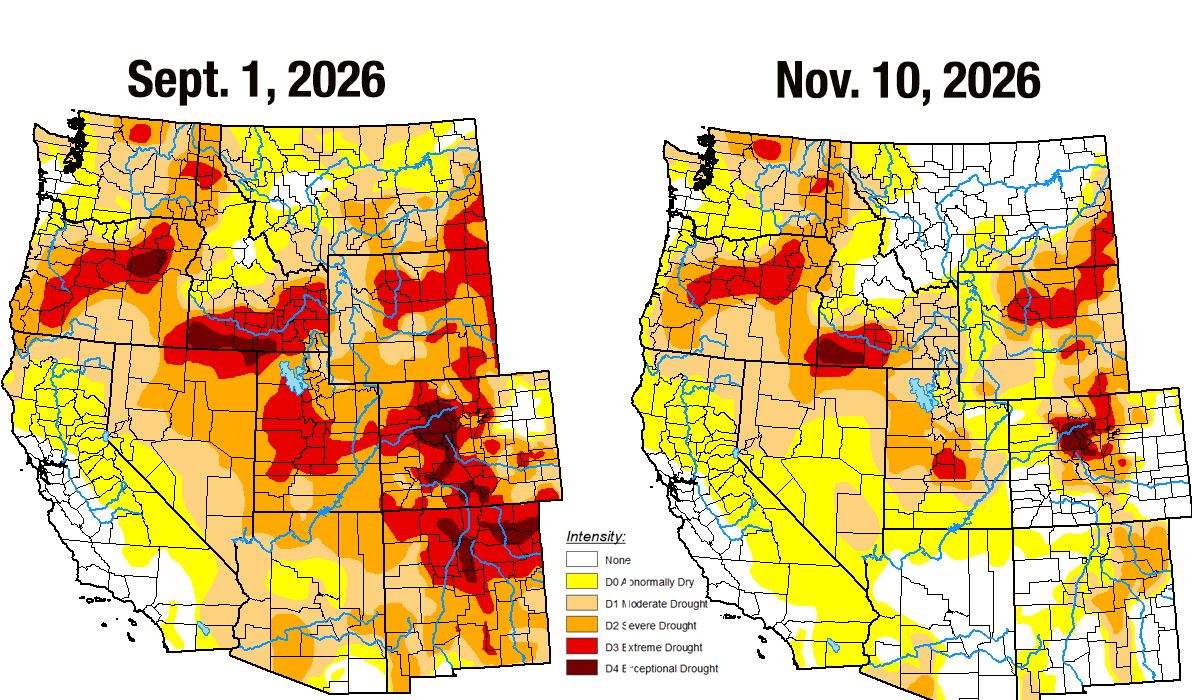
So far, the storms have mostly followed a typical El Niño pattern, which is to say that the moisture has been concentrated in the Southwest, while more northern areas have stayed relatively dry — or at least less moist. While drought has eased in or disappeared from the Four Corners region, it persists at extreme and exceptional levels in north-central Colorado, near where the Colorado River begins. In other words, the Upper Colorado River Basin is basically split in half, meaning relatively dry conditions near the headwaters could offset abundant moisture in the San Juans and other more southern mountain ranges. Of course, it’s still too early to tell where the El Niño lines dividing the unusually wet areas from the average and below normal precipitation areas will fall during the heavy snowfall months.
Numbers from the CoCoRaHS Mapping System illustrate just how wet it was during the first five weeks of the water year. The following are some accumulated precipitation totals from 10/31 to 11/3 for select locations:
7 miles NW of Pagosa Springs: 4.61 inches
In Pagosa Springs: 3.88 inches
Durango: 3.46 inches
Electra Lake (Terminal Dam in table below): 4.78 inches
Four miles west of Mancos: 4.04 inches
Silverton: 2.5 inches (this is a 24-hour total reported on the morning of Nov. 2 by Freddie Canfield, Silverton weather-observer extraordinaire. There is no CoCoRaHS observer in the area.)
Cherry Creek (between Hesperus and Mancos; this was the closest observer to the old Fort Lewis south of Hesperus): 4.13 inches
Chromo: 3.24 inches
5 miles east-northeast of Dolores: 4.13
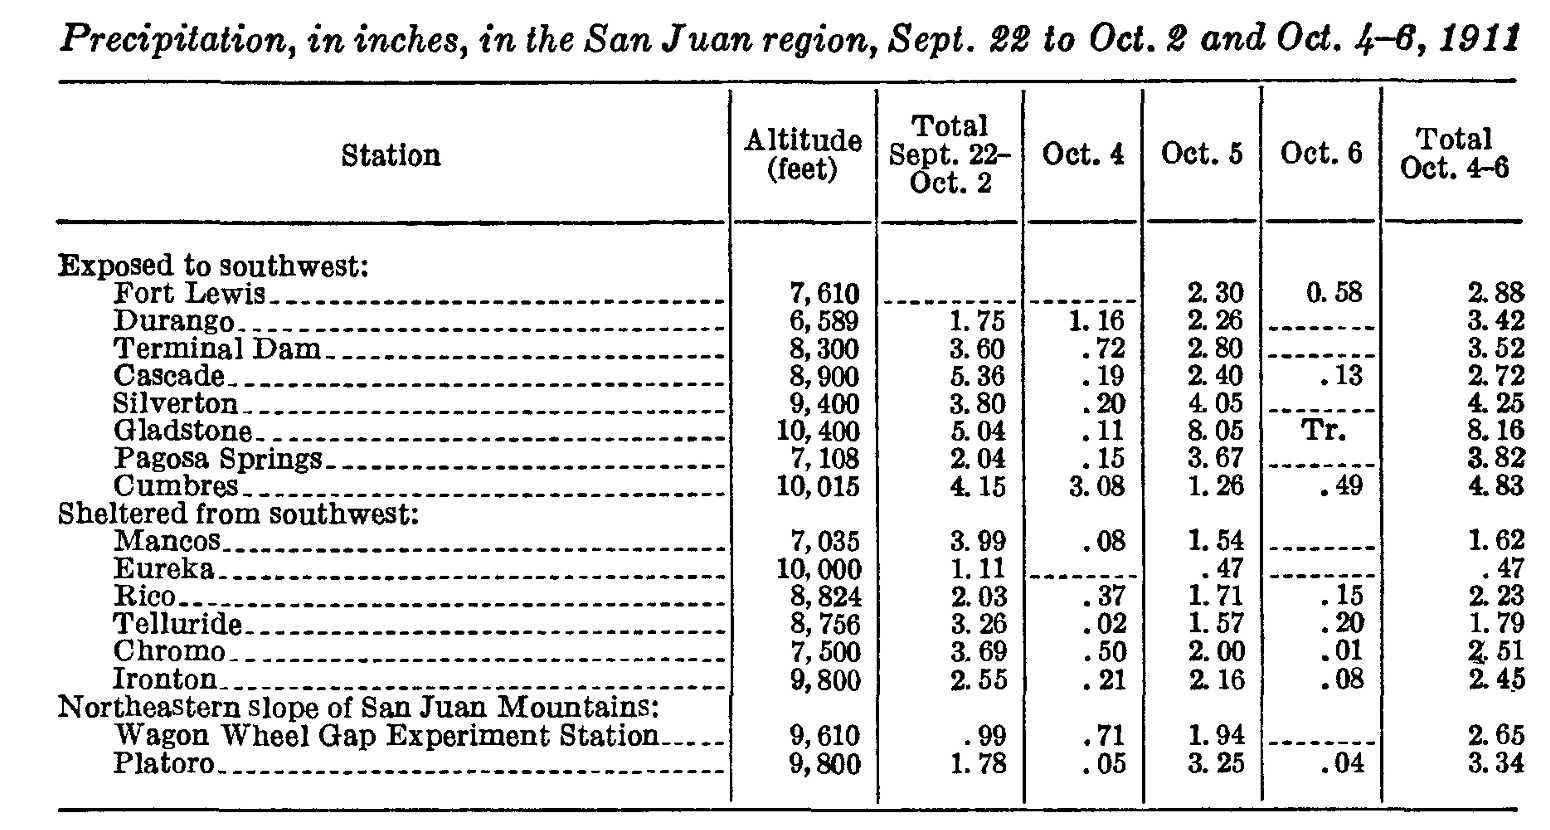
Now compare those amounts to rainfall amounts in the storms preceding the October 1911 flood.
The graphs below are for water years (10/1-9/30), not calendar years (1/1-12/31). It’s a better timeframe for conceptualizing water, because the calendar year cuts the critical snow season in half, which doesn’t really allow you to compare one winter to another. The Water Year, on the other hand, begins right about when snow starts falling in the high country, and ends after the irrigation season. The USGS’s peak streamflow data is compiled by water year, not calendar year. Water Year 2027 began on Oct. 1, 2026, and ends on Sept. 30, 2027. That’s why this year’s floods show up as 2027 (and the Oct. 1911 flood shows up as 1912).
I also use streamflow (cubic feet per second) rather than gage height. I do this for two reasons: 1. I find that streamflow is less dependent on place and enables you to compare the San Juan River in Pagosa, for example, to the Animas River in Durango, because 2,000 cfs is the same amount of water in each place. Gage height doesn’t transfer from one place to another as easily, because it’s more dependent on the channel depth and width and so forth. 2. The USGS data does not show gage heights for every year on record, even when it does show streamflows.
6,072 feet: Surface level of Navajo Reservoir on Nov. 14, 2026, 62 feet above the Sept. 14 level. It went from just 46% full to 86% full in two months, during which it captured an estimated 700,000 acre-feet of water, equivalent to more than twice Nevada’s total annual allotment from the Colorado River.
63,368 cubic feet per second: Volume of water flowing into Lake Powell on Oct. 22, 2026. That’s the highest daily inflow since May 21, 2023, when an abundant snowmelt raised inflows to just over 74,000 cfs.
1.28 million acre-feet: Volume of water that flowed into Lake Powell during October 2026, the largest monthly inflow since June 2024.
3,540 feet: Surface level of Lake Powell on Nov. 15, 2026, 24 feet above the Sept. 19 level of 3,516 feet, which was an all-time low and just six feet above the level (3,510) that the Bureau of Reclamation had vowed to “defend” by limiting releases from Glen Canyon Dam. While the boost buys dam operators (and Colorado River users and managers) some time, the level remains about four feet below what it was on this same date last year, and the reservoir is only 27% full.
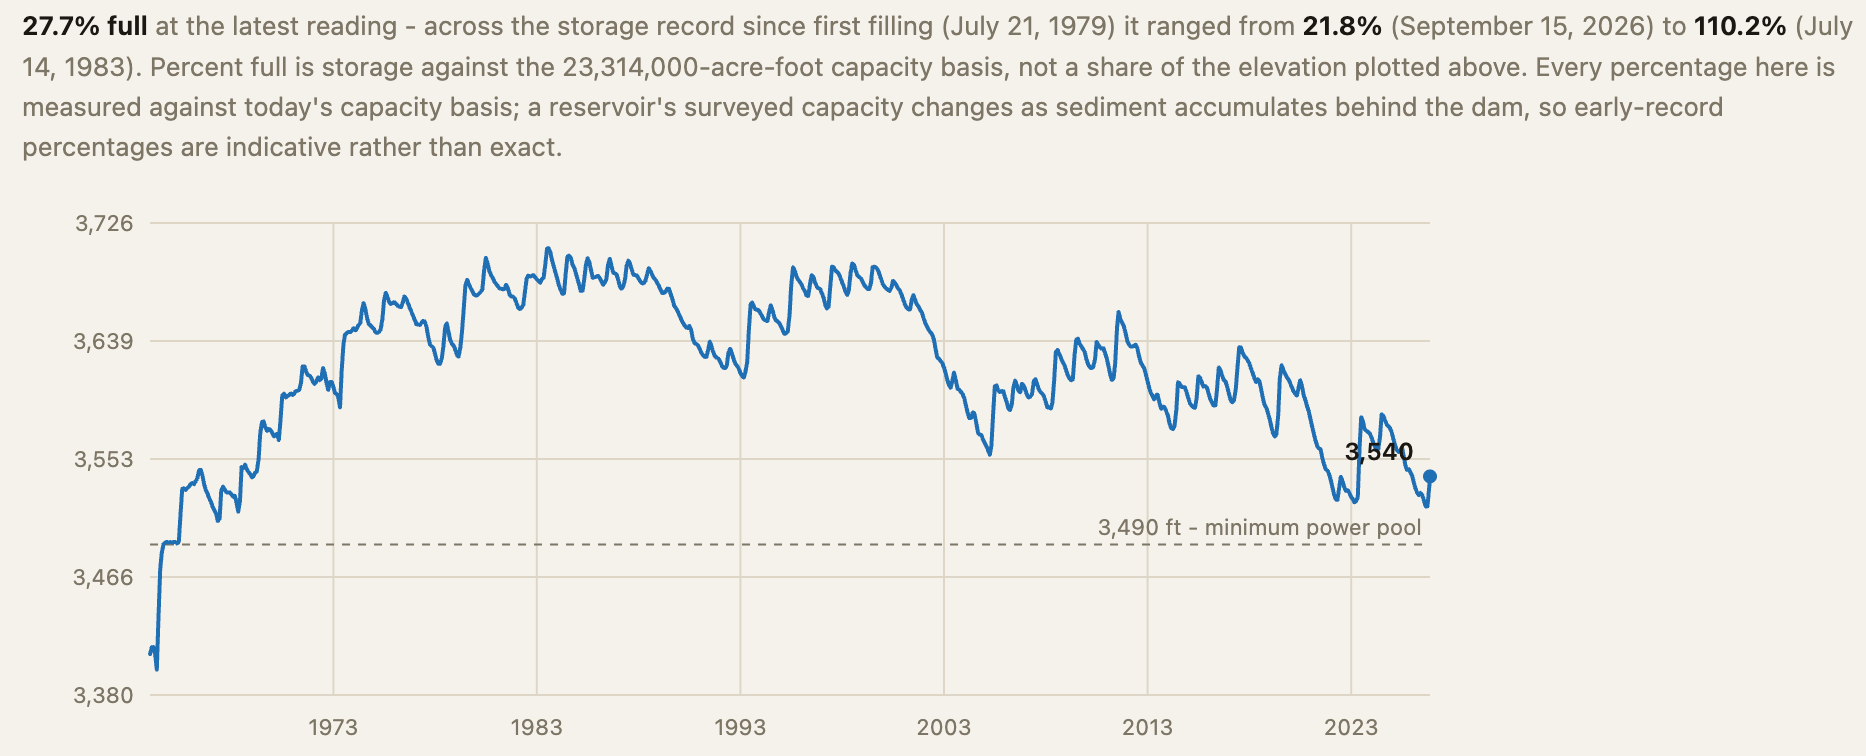
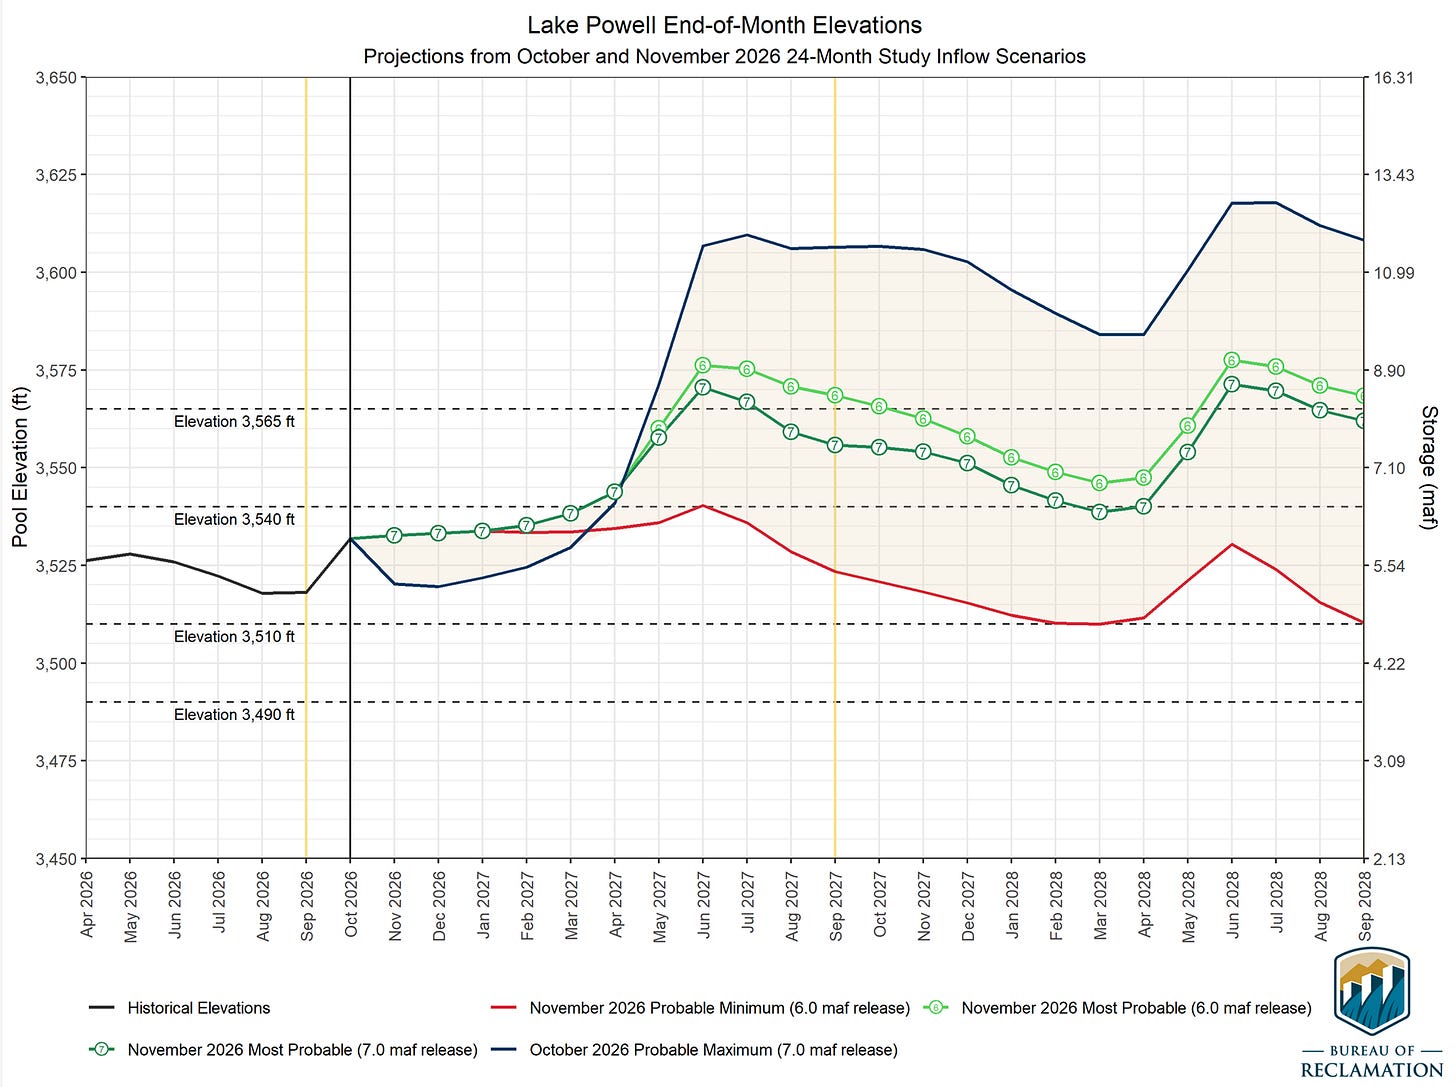
Lake Powell’s surface elevation from 1963 to Nov. 16, 2026. Source: Reservoirbench The deluge, and an apparent assumption that the weather pattern will continue throughout the winter, has brightened water managers’ outlook for Lake Powell (as seen in the graph below). But these “most probable” projections rely not only on a big 2026-27 winter, but also an abundant 27-28 winter, both with limited downstream releases from Glen Canyon Dam (6 MAF and 7 MAF). And even then, it has the reservoir ending water year 2028 at just about half of capacity, gains that could be wiped out in just one or two below-average winters.

The urgency to cut consumption throughout the river basin, in other words, remains.
📸 PARTING SHOT 🎞️